Meteostat Python
Access and analyze historical weather and climate data with Python.
https://github.com/meteostat/meteostat
Keywords
climate climate-change climate-data data-science meteostat open-data statistics weather weather-data weather-station
Last synced: 1 day ago
JSON representation
Acceptance Criteria
- Revelant topics? true
- External users? true
- Open source license? true
- Active? true
- Fork? false
Repository metadata
Access and analyze historical weather and climate data with Python.
- Host: GitHub
- URL: https://github.com/meteostat/meteostat
- Owner: meteostat
- License: mit
- Created: 2020-08-05T15:47:15.000Z (almost 6 years ago)
- Default Branch: main
- Last Pushed: 2026-07-02T14:38:00.000Z (23 days ago)
- Last Synced: 2026-07-02T16:29:20.802Z (22 days ago)
- Topics: climate, climate-change, climate-data, data-science, meteostat, open-data, statistics, weather, weather-data, weather-station
- Language: Python
- Homepage: https://dev.meteostat.net/python
- Size: 16.7 MB
- Stars: 657
- Watchers: 7
- Forks: 80
- Open Issues: 16
- Releases: 61
-
Metadata Files:
- Readme: README.md
- Contributing: CONTRIBUTING.md
- Funding: .github/FUNDING.yml
- License: LICENSE
- Citation: CITATION.cff
- Agents: AGENTS.md
README.md
![]()
![]()


📚 Installation
The Meteostat Python package is available through PyPI:
pip install meteostat
🚀 Usage
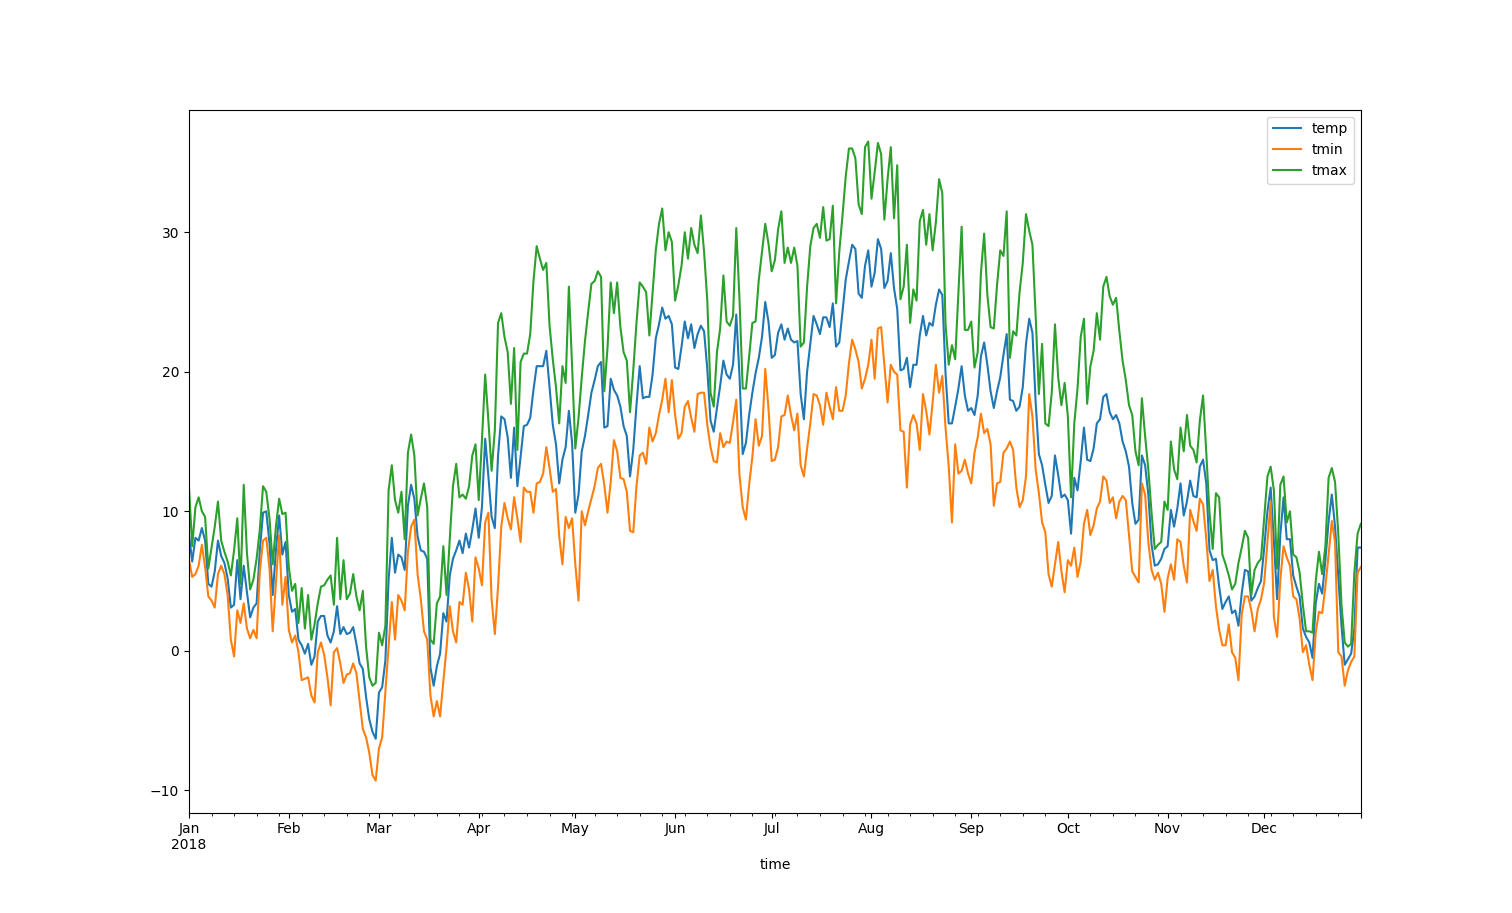
Let's plot 2018 temperature data for Frankfurt, Germany:
from datetime import date
import matplotlib.pyplot as plt
import meteostat as ms

# Specify location and time range
POINT = ms.Point(50.1155, 8.6842, 113)  # Try with your location
START = date(2018, 1, 1)
END = date(2018, 12, 31)

# Get nearby weather stations
stations = ms.stations.nearby(POINT, limit=4)

# Get daily data & perform interpolation
ts = ms.daily(stations, START, END)
df = ms.interpolate(ts, POINT).fetch()

# Plot line chart including average, minimum and maximum temperature
df.plot(y=[ms.Parameter.TEMP, ms.Parameter.TMIN, ms.Parameter.TMAX])
plt.show()
Take a look at the expected output:
🤝 Contributing
Please read our contributing guidelines for details on how to contribute to the Meteostat Python library.
Top contributors
🌟 Featured In
Meteostat has been featured and used by various media outlets and organizations, including:
Join the growing community of users and researchers relying on Meteostat for their weather data needs.
📄 License
Meteostat is licensed under the MIT License. Data provided by Meteostat is generally licensed under the Creative Commons Attribution 4.0 International (CC BY 4.0) license. Please refer to the documentation for more information.
Citation (CITATION.cff)
cff-version: 1.2.0
title: Meteostat Python
message: >-
  If you use this software, please cite it using the
  metadata from this file.
type: software
authors:
  - given-names: Christian Sebastian
    family-names: Lamprecht
    email: cla@meteostat.net
    orcid: 'https://orcid.org/0000-0003-3301-2852'
Owner metadata
- Name: Meteostat
- Login: meteostat
- Email: info@meteostat.net
- Kind: organization
- Description: The Weather's Record Keeper
- Website: https://meteostat.net
- Location:
- Twitter: meteost
- Company:
- Icon url: https://avatars.githubusercontent.com/u/29773680?v=4
- Repositories: 14
- Last ynced at: 2024-04-12T23:41:58.133Z
- Profile URL: https://github.com/meteostat
GitHub Events
Total
- Release event: 3
- Delete event: 18
- Pull request event: 33
- Discussion event: 1
- Issues event: 21
- Watch event: 32
- Issue comment event: 37
- Push event: 68
- Pull request review event: 12
- Pull request review comment event: 19
- Create event: 7
Last Year
- Release event: 3
- Delete event: 18
- Pull request event: 33
- Discussion event: 1
- Issues event: 21
- Watch event: 32
- Issue comment event: 37
- Push event: 68
- Pull request review event: 12
- Pull request review comment event: 19
- Create event: 7
Committers metadata
Last synced: 27 days ago
Total Commits: 326
Total Committers: 4
Avg Commits per committer: 81.5
Development Distribution Score (DDS): 0.052
Commits in past year: 110
Committers in past year: 2
Avg Commits per committer in past year: 55.0
Development Distribution Score (DDS) in past year: 0.127
| Name | Commits | |
|---|---|---|
| clampr | c****t@a****e | 309 |
| Copilot | 1****t | 14 |
| christianlamprecht | c****t@d****m | 2 |
| e-hamza | 3****a | 1 |
Committer domains:
- deutschebahn.com: 1
- aol.de: 1
Issue and Pull Request metadata
Last synced: 21 days ago
Total issues: 11
Total pull requests: 4
Average time to close issues: 3 days
Average time to close pull requests: about 10 hours
Total issue authors: 7
Total pull request authors: 2
Average comments per issue: 13.18
Average comments per pull request: 2.25
Merged pull request: 2
Bot issues: 5
Bot pull requests: 0
Past year issues: 11
Past year pull requests: 4
Past year average time to close issues: 3 days
Past year average time to close pull requests: about 10 hours
Past year issue authors: 7
Past year pull request authors: 2
Past year average comments per issue: 13.18
Past year average comments per pull request: 2.25
Past year merged pull request: 2
Past year bot issues: 5
Past year bot pull requests: 0
Top Issue Authors
- github-actions[bot] (5)
- lenwood (1)
- ddabble (1)
- RDJT13 (1)
- gu62jen (1)
- rjhare (1)
- arthurmluz (1)
Top Pull Request Authors
- Copilot (3)
- clampr (1)
Top Issue Labels
- agentic-workflows (5)
- bug (4)
- documentation (2)
- confirmed (1)
- question (1)
Top Pull Request Labels
Package metadata
- Total packages: 1
-
Total downloads:
- pypi: 701,389 last-month
- Total docker downloads: 138
- Total dependent packages: 10
- Total dependent repositories: 41
- Total versions: 62
- Total maintainers: 1
pypi.org: meteostat
Access and analyze historical weather and climate data with Python.
- Homepage:
- Documentation: https://meteostat.readthedocs.io/
- Licenses: mit
- Latest release: 2.1.4 (published 4 months ago)
- Last Synced: 2026-06-07T02:00:29.788Z (about 2 months ago)
- Versions: 62
- Dependent Packages: 10
- Dependent Repositories: 41
- Downloads: 701,389 Last month
- Docker Downloads: 138
-
Rankings:
- Downloads: 1.592%
- Dependent packages count: 1.597%
- Dependent repos count: 2.295%
- Average: 3.226%
- Stargazers count: 3.604%
- Docker downloads count: 3.813%
- Forks count: 6.452%
- Maintainers (1)
Dependencies
- actions/checkout v2 composite
- actions/setup-python v1 composite
- actions/checkout v2 composite
- actions/setup-python v1 composite
- actions/checkout v4 composite
- actions/setup-python v4 composite
- actions/checkout v4 composite
- actions/github-script v7 composite
- actions/setup-python v4 composite
- snok/install-poetry v1 composite
- actions/checkout v4 composite
- actions/setup-python v4 composite
- snok/install-poetry v1 composite
- colorama 0.4.6 develop
- iniconfig 2.1.0 develop
- packaging 25.0 develop
- pluggy 1.6.0 develop
- pygments 2.19.2 develop
- pytest 8.4.2 develop
- pytest-mock 3.15.1 develop
- ruff 0.14.8 develop
- ty 0.0.1a33 develop
- types-pytz 2023.4.0.20240130 develop
- types-requests 2.32.4.20250913 develop
- urllib3 2.5.0 develop
- contourpy 1.3.3 extras
- cycler 0.12.1 extras
- fonttools 4.60.1 extras
- kiwisolver 1.4.9 extras
- lxml 5.4.0 extras
- matplotlib 3.10.7 extras
- metar 1.11.0 extras
- numpy 2.3.3 extras
- packaging 25.0 extras
- pillow 11.3.0 extras
- pyparsing 3.2.5 extras
- python-dateutil 2.9.0.post0 extras
- six 1.17.0 extras
- certifi 2025.10.5
- charset-normalizer 3.4.3
- idna 3.10
- numpy 2.3.3
- pandas 2.3.3
- python-dateutil 2.9.0.post0
- pytz 2023.4
- requests 2.32.5
- six 1.17.0
- tzdata 2025.2
- urllib3 2.5.0
- pytest ^8.2.1 develop
- pytest-mock ^3.14.0 develop
- ruff ^0.14.8 develop
- ty ^0.0.1a33 develop
- types-pytz ^2023.3.1.1 develop
- types-requests ^2.31.0.20240106 develop
- lxml ^5.3.0 extras
- matplotlib ^3.9.2 extras
- metar ^1.11.0 extras
- pandas >=2.3.0,<4.0.0
- python ^3.11
- pytz ^2023.3.post1
- requests ^2.31.0
- actions/checkout de0fac2e4500dabe0009e67214ff5f5447ce83dd composite
- actions/download-artifact 018cc2cf5baa6db3ef3c5f8a56943fffe632ef53 composite
- actions/github-script ed597411d8f924073f98dfc5c65a23a2325f34cd composite
- actions/upload-artifact b7c566a772e6b6bfb58ed0dc250532a479d7789f composite
- github/gh-aw/actions/setup 5988e5ce8019318837dfd26303351a4ba704a3c8 composite
Score: 21.359132754831375