Green Metrics Tool
An open source suite to measure, display and compare software energy and CO2 consumption for containerized software. External power meters as well as RAPL and also ML-estimation models are supported.
https://github.com/green-coding-solutions/green-metrics-tool
Category: Consumption
Sub Category: Computation and Communication
Keywords
carbon-emissions carbon-footprint carbon-measurement climate-change co2-emissions co2-footprint co2-measurement energy-consumption-analysis green-coding green-computing green-software metrics power-consumption power-consumption-measurement sustainability sustainable-software
Keywords from Contributors
carbon-footprint-calculator carbon-footprint-estimation climate-change-mitigation green-energy metrics-gathering sustainable-development-goals energy-consumption
Last synced: about 18 hours ago
JSON representation
Repository metadata
Measure energy consumption and carbon emissions of software - Timelines, git-integration, Comparions, Dashboards and Optimizations included
- Host: GitHub
- URL: https://github.com/green-coding-solutions/green-metrics-tool
- Owner: green-coding-solutions
- License: other
- Created: 2022-02-25T13:45:29.000Z (over 4 years ago)
- Default Branch: main
- Last Pushed: 2026-07-14T13:24:29.000Z (9 days ago)
- Last Synced: 2026-07-15T05:06:33.685Z (8 days ago)
- Topics: carbon-emissions, carbon-footprint, carbon-measurement, climate-change, co2-emissions, co2-footprint, co2-measurement, energy-consumption-analysis, green-coding, green-computing, green-software, metrics, power-consumption, power-consumption-measurement, sustainability, sustainable-software
- Language: Python
- Homepage: https://metrics.green-coding.io
- Size: 25.7 MB
- Stars: 251
- Watchers: 3
- Forks: 45
- Open Issues: 67
- Releases: 44
-
Metadata Files:
- Readme: README.md
- Contributing: CONTRIBUTING.md
- License: LICENSE
- Citation: CITATION.cff
- Security: SECURITY.md
- Agents: AGENTS.md
README.md
![]()
(This is the carbon emitted for running our CI-Pipelines to test GMT on Github. Find out more about Eco-CI)
![]()
Introduction
The Green Metrics Tool is a developer tool indented for measuring the energy and CO2 consumption of software through a software life cycle analysis (SLCA).
Key features are:
- Reproducible measurements through configuration/setup-as-code
- POSIX style metric providers for many sensors (RAPL, IPMI, PSU, Docker, Temperature, CPU ...)
- Low overhead
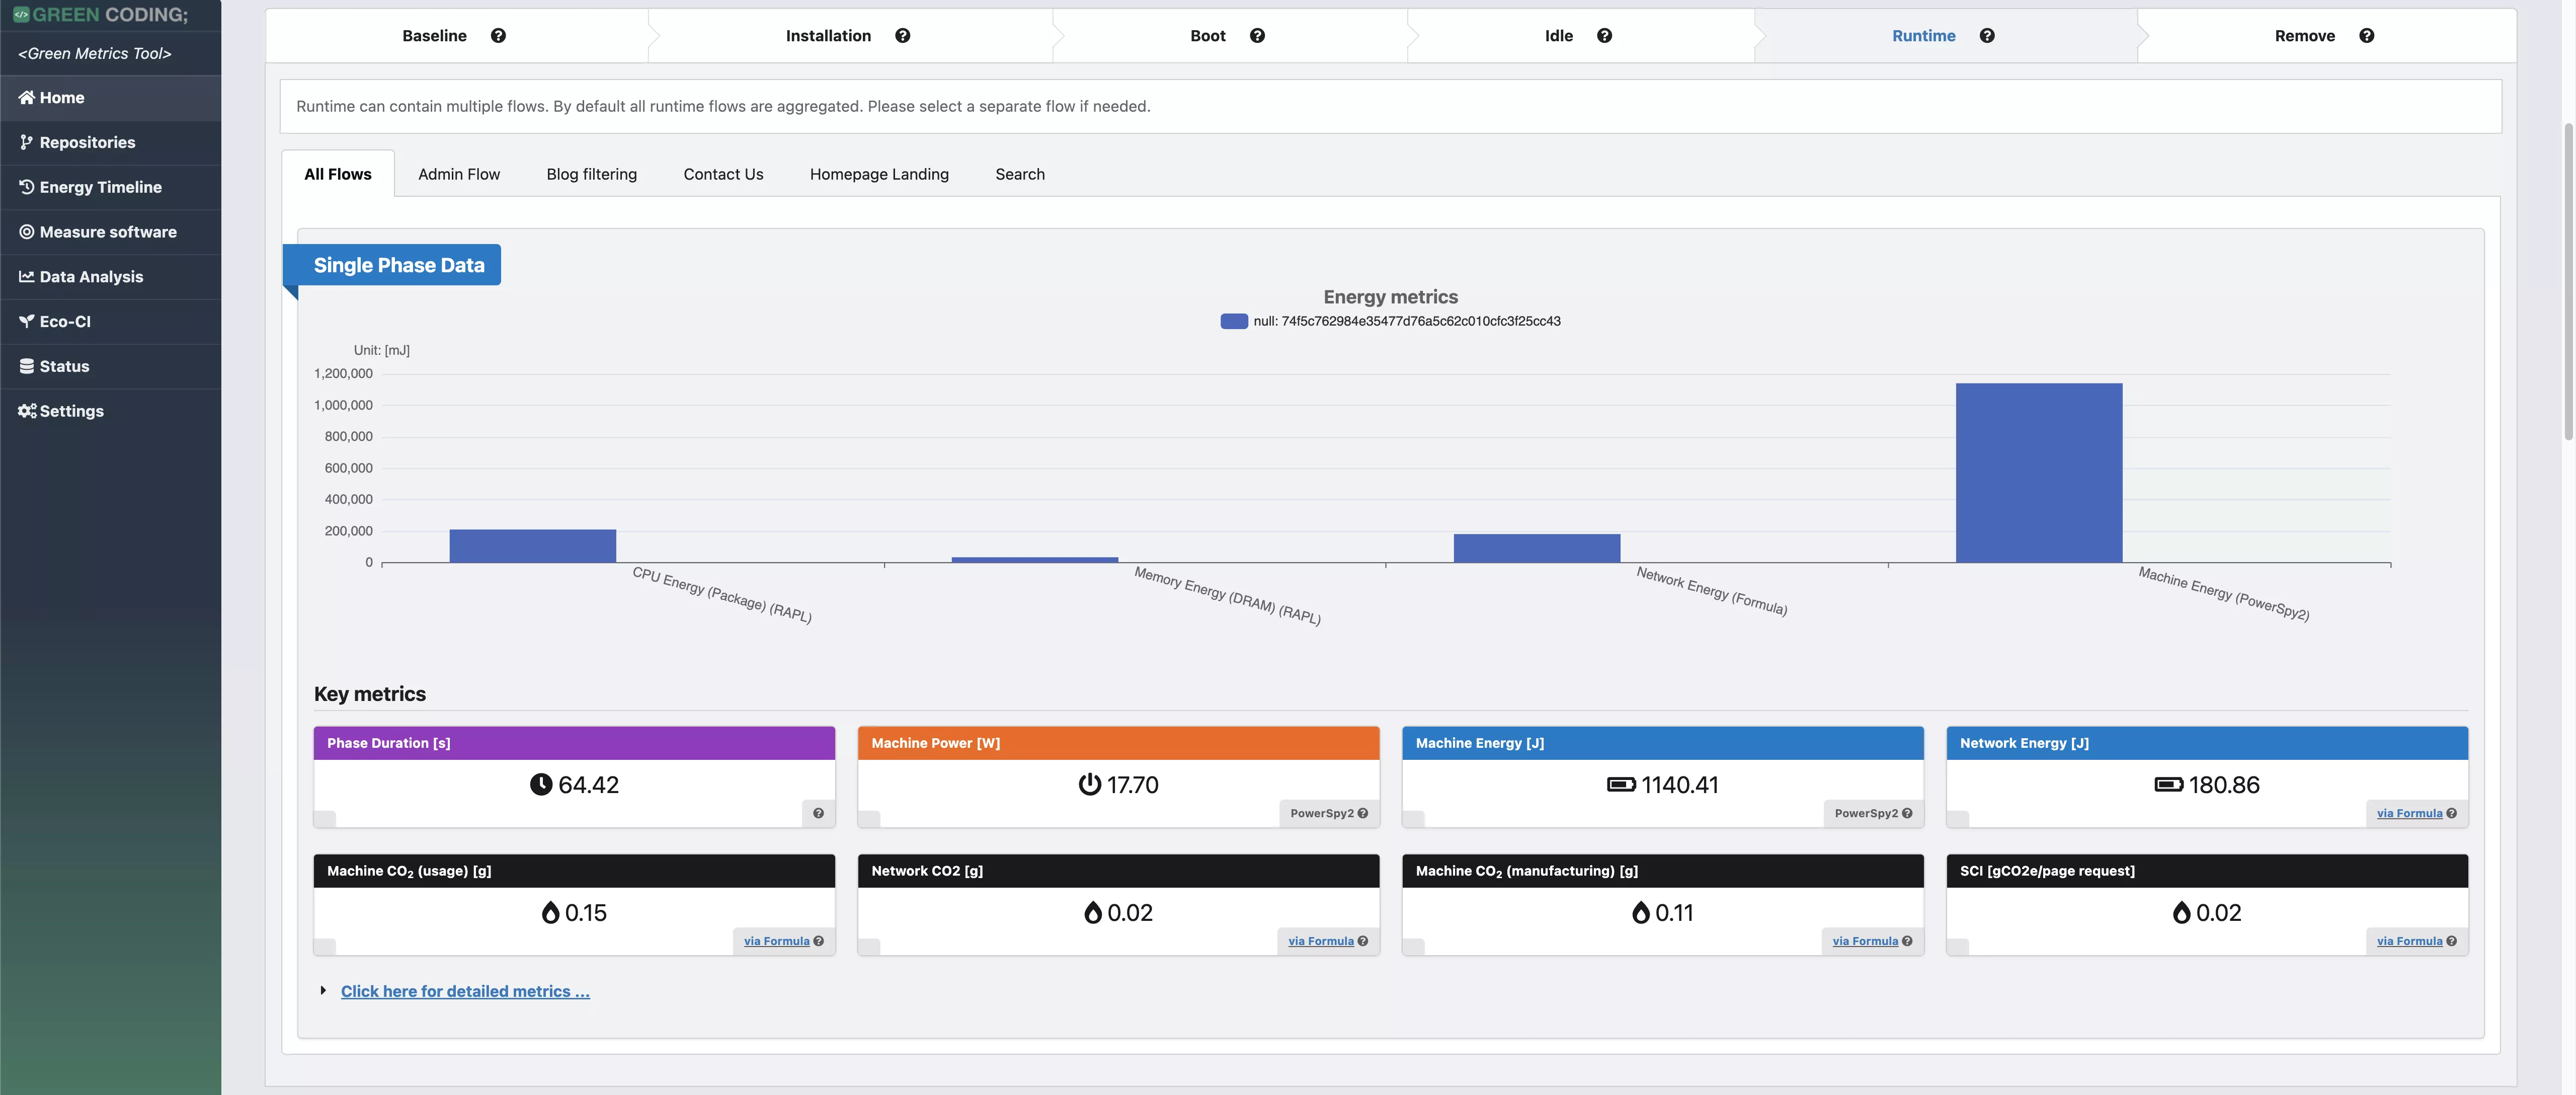
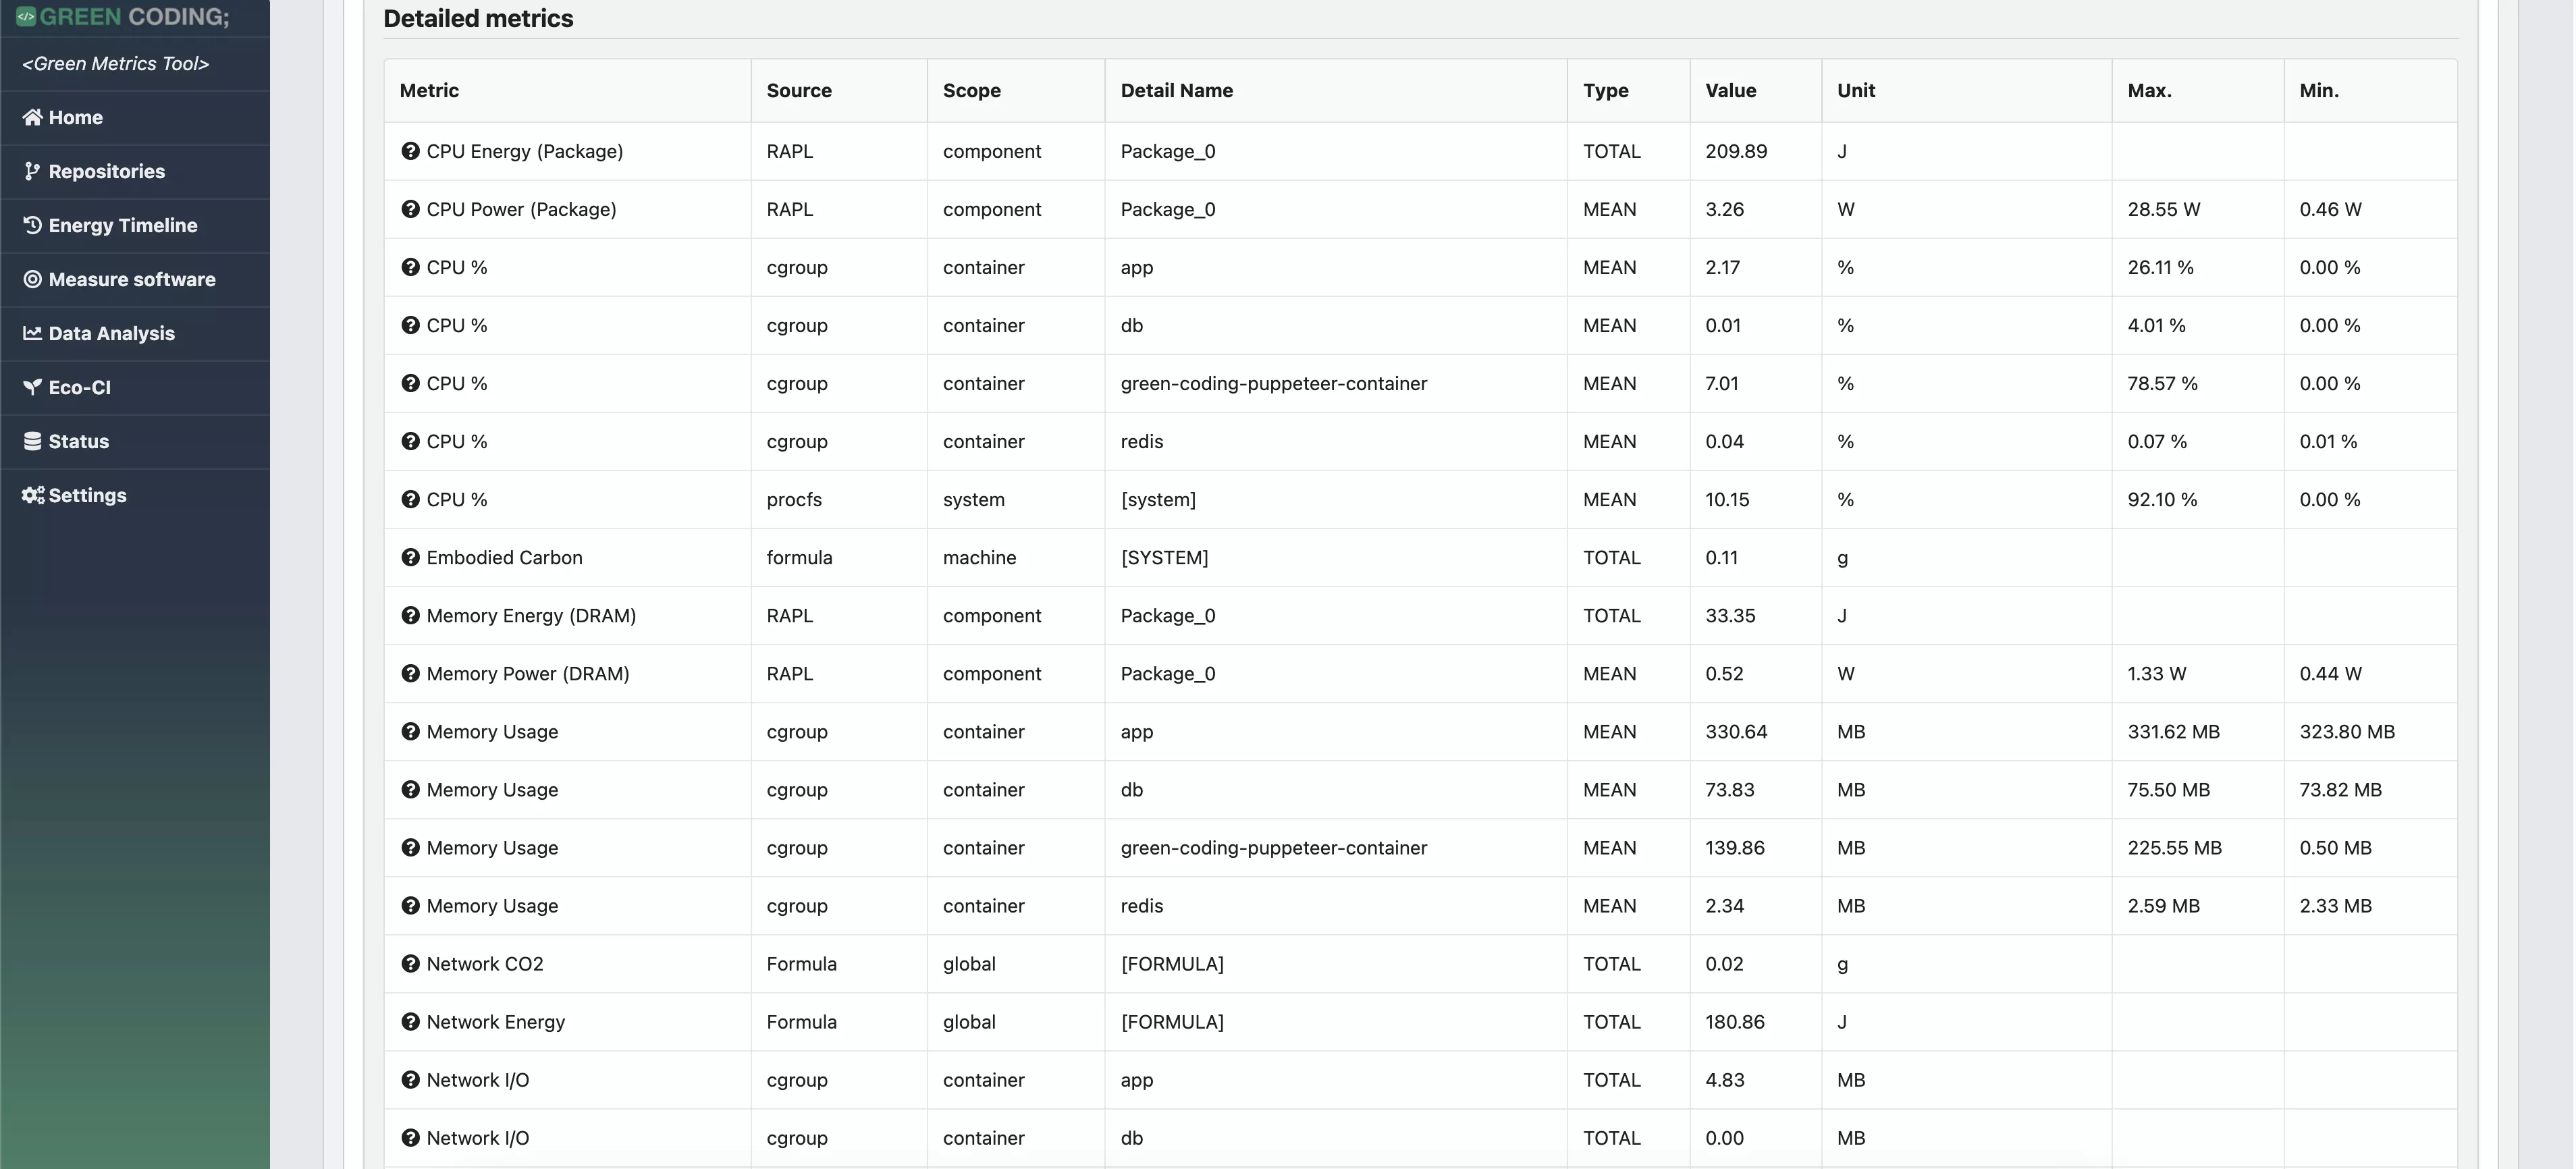
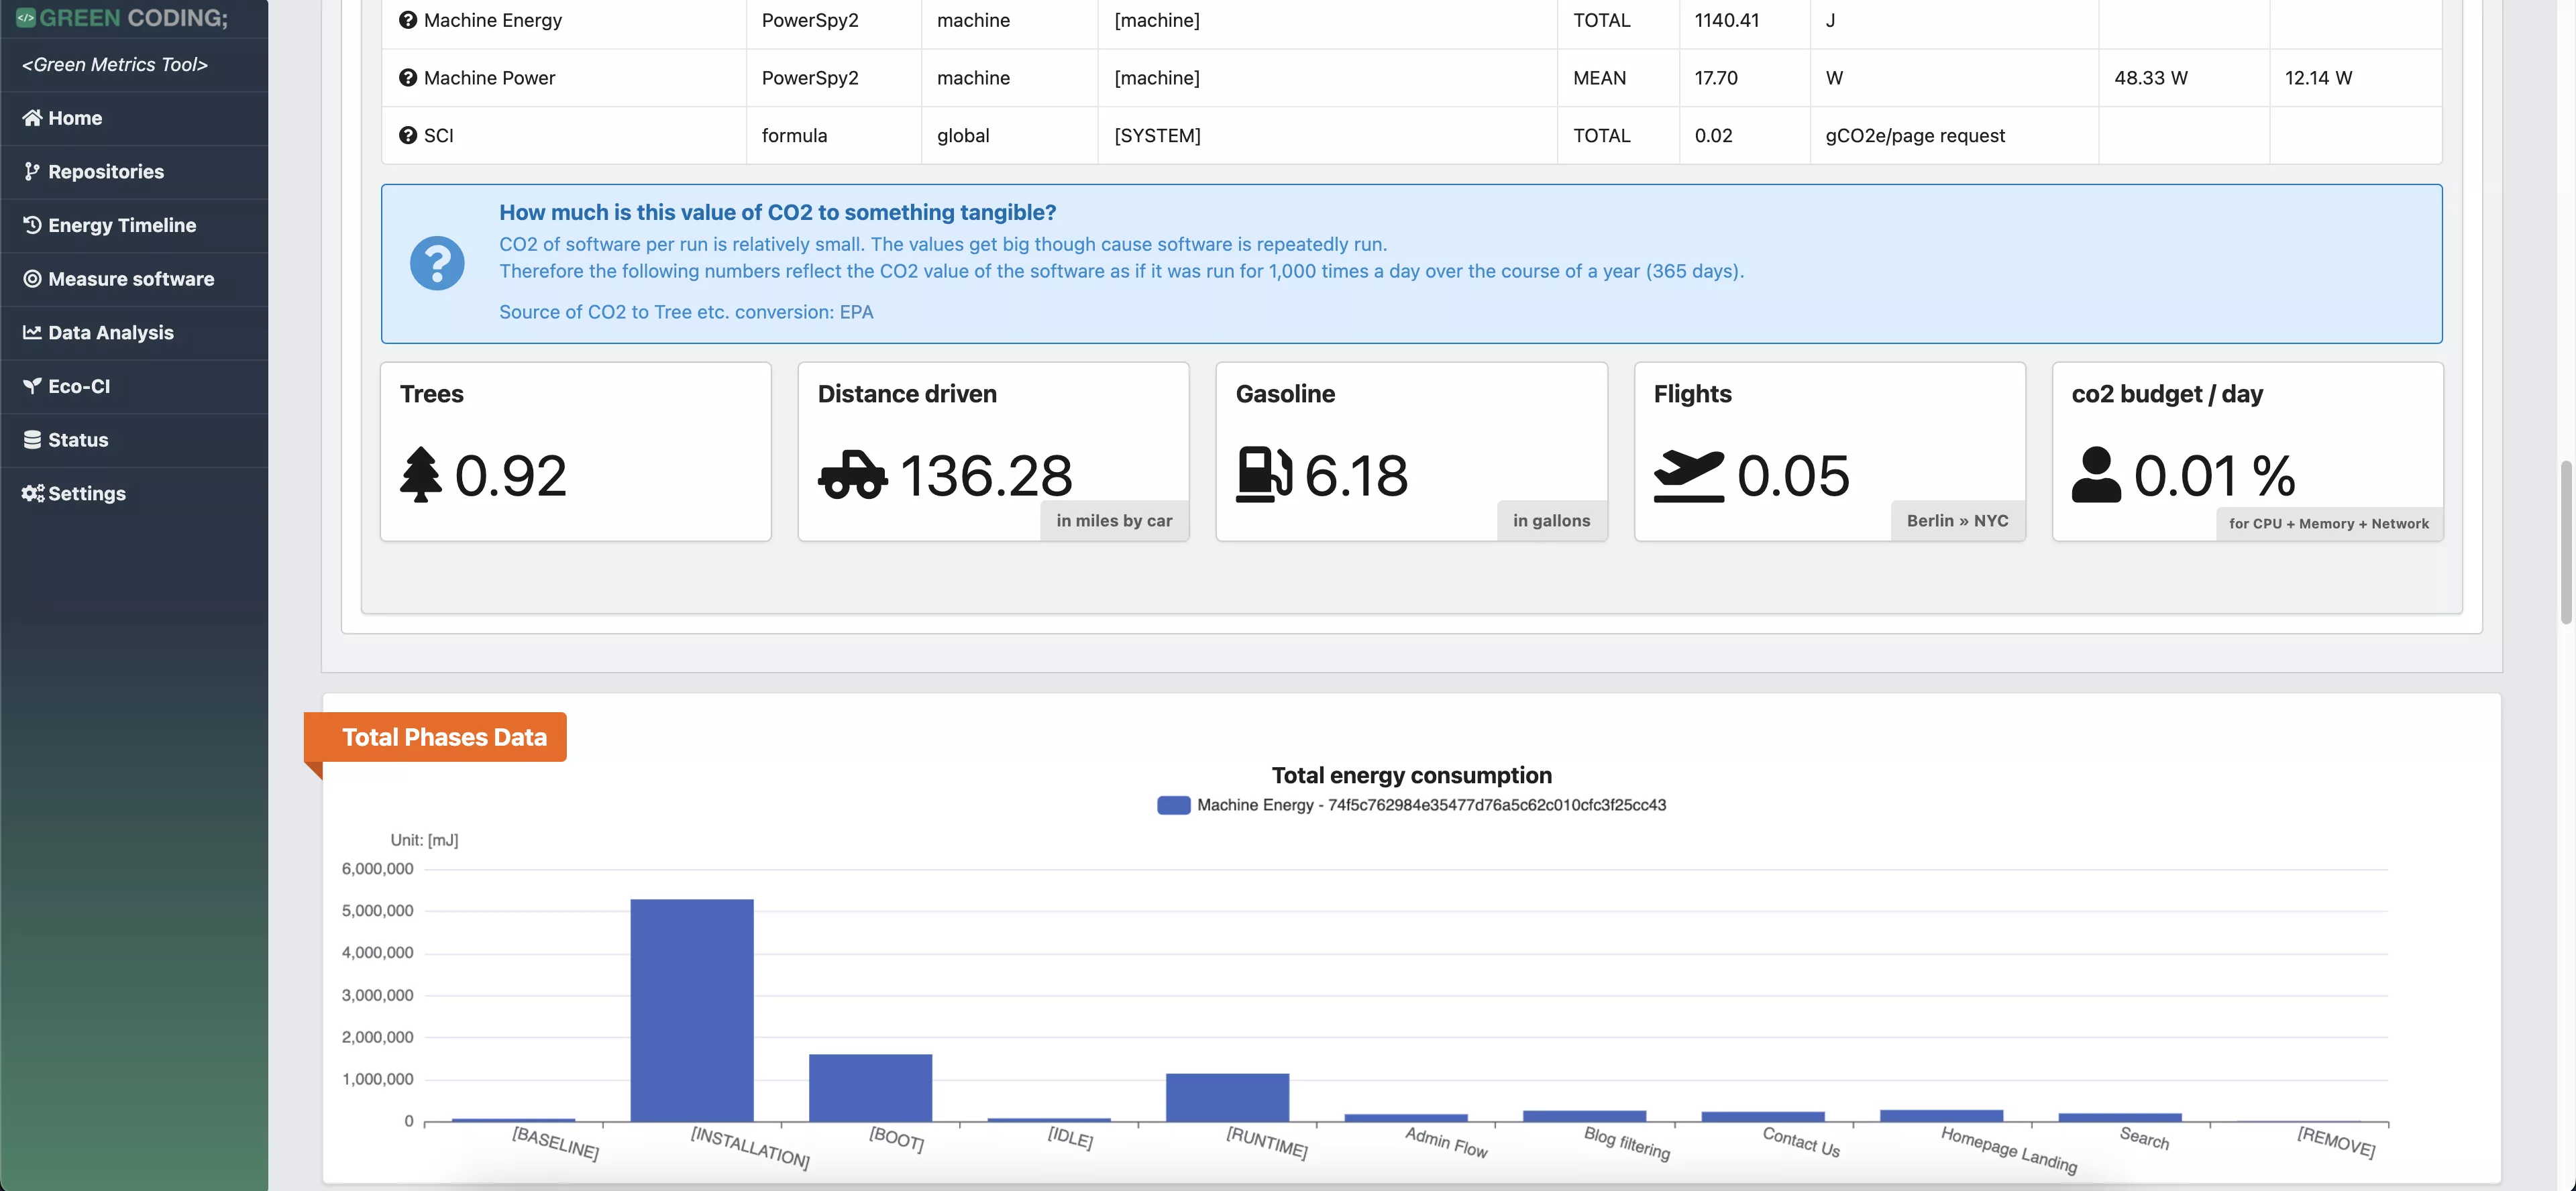
- Statististical frontend with charts - DEMO
- API - DEMO
- Cluster setup
- Free Hosted service for more precise measurements
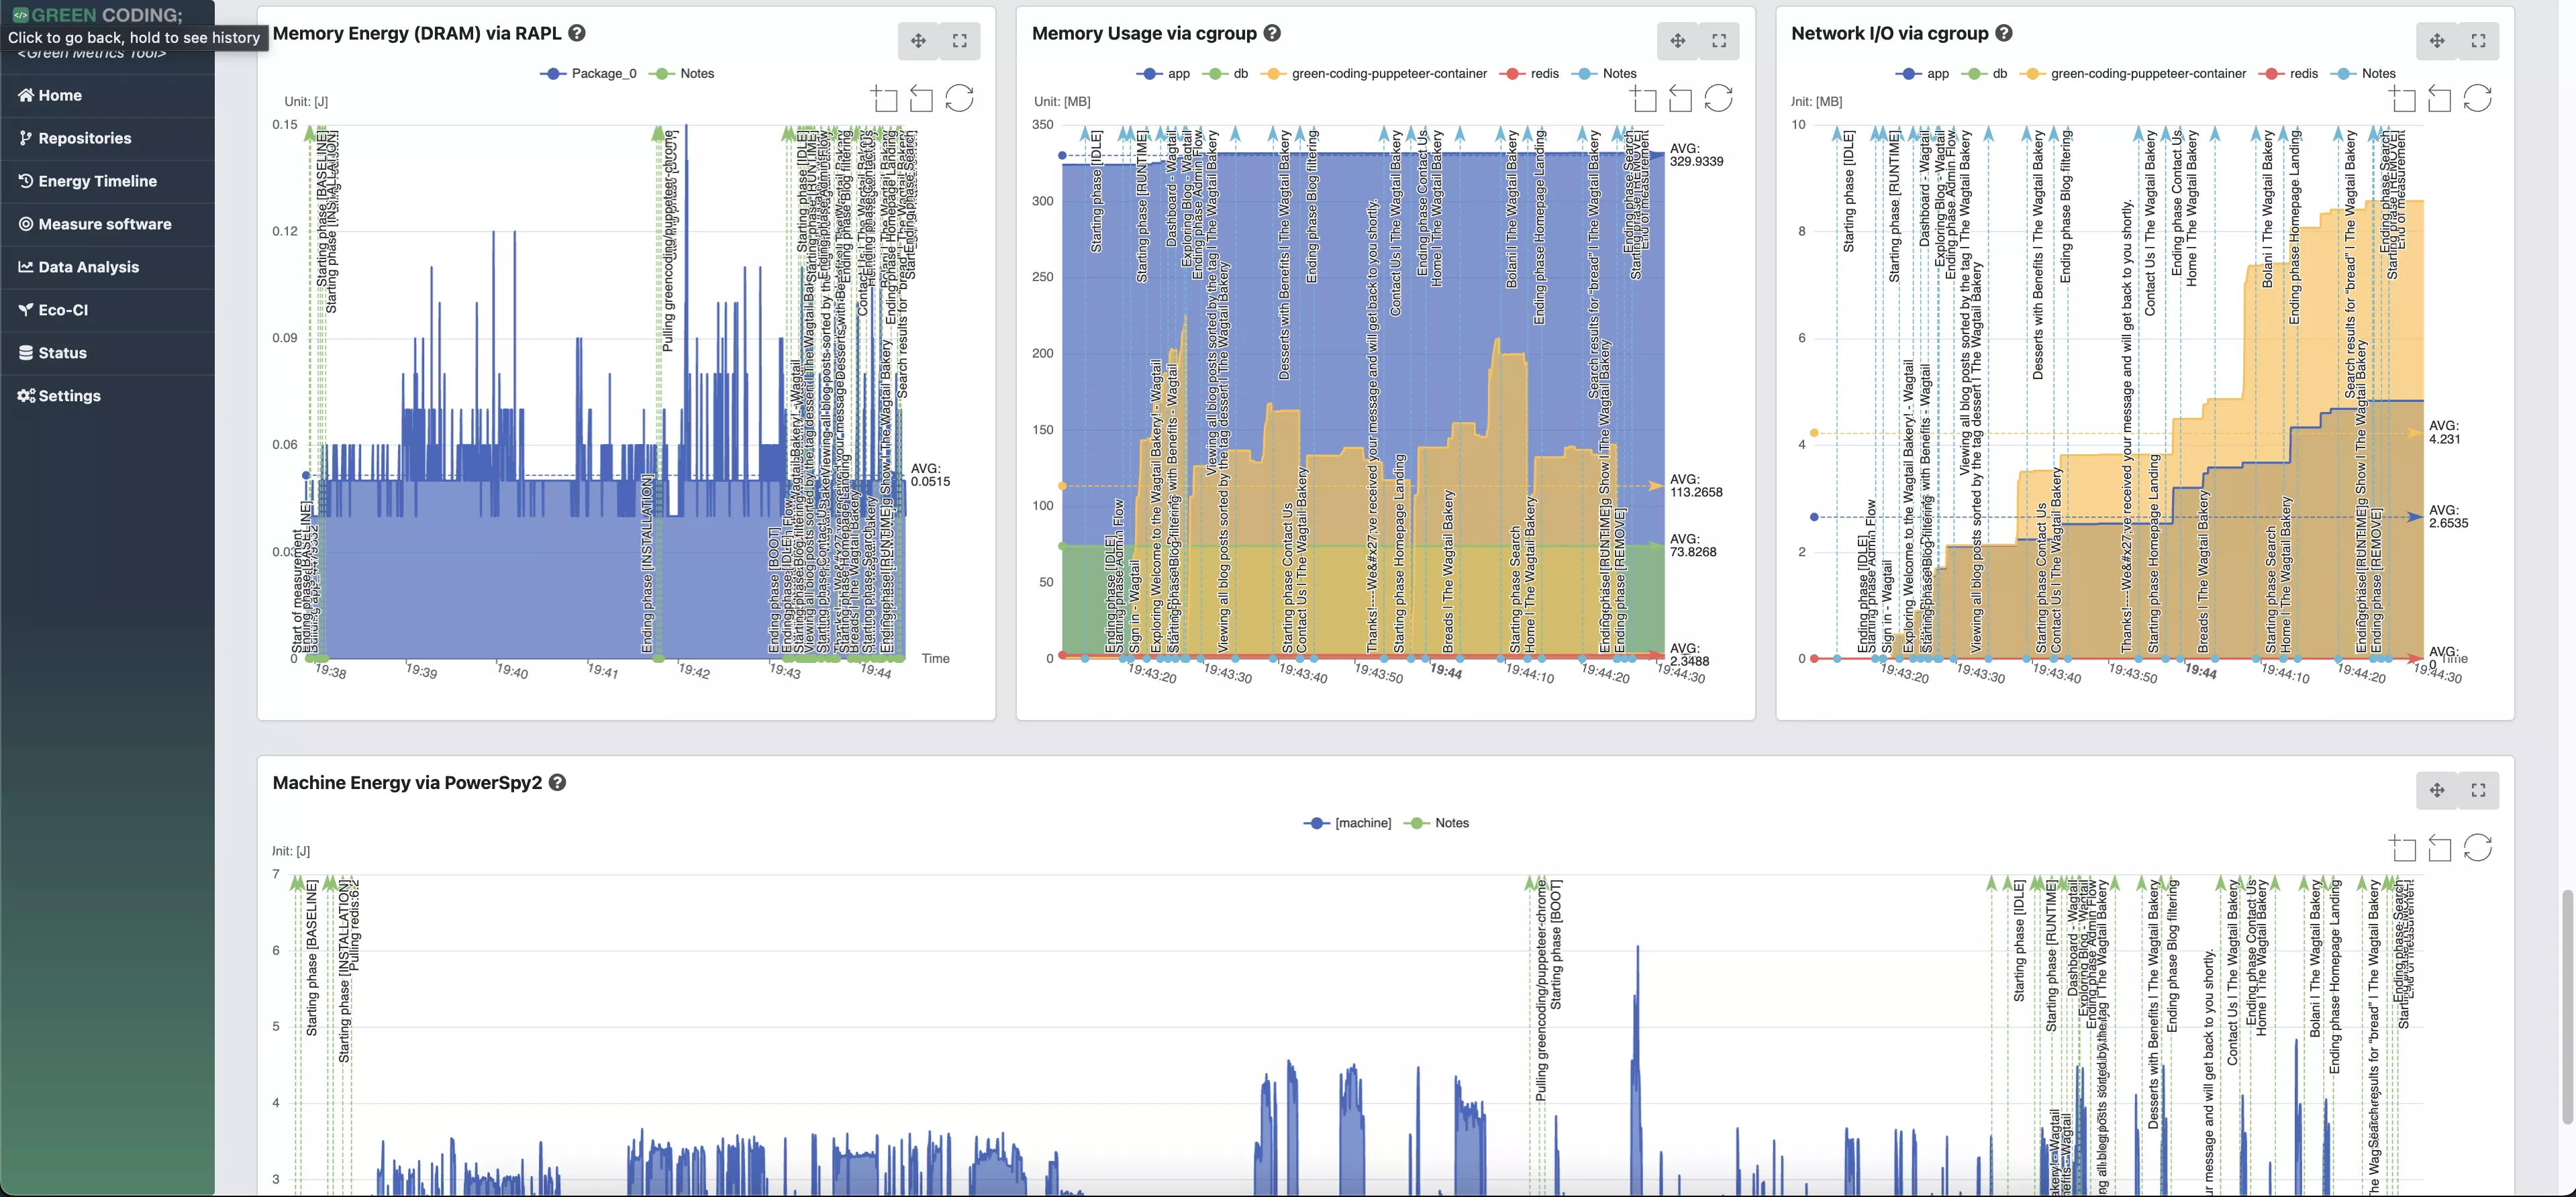
- Timeline-View: Monitor software projects over time - DEMO for Wagtail / DEMO Overview
- Energy ID Score-Cards for software (Also see below)
It is designed to re-use existing infrastructure and testing files as much as possible to be easily integrateable into every software repository and create transparency around software energy consumption.
It can orchestrate Docker containers according to a given specificaion in a usage_scenario.yml file.
These containers will be setup on the host system and the testing specification in the usage_scenario.yml will be
run by sending the commands to the containers accordingly.
This repository contains the command line tools to schedule and run the measurement report
as well as a web interface to view the measured metrics in some nice charts.
Frontend
To see the frontend in action and get an idea of what kind of metrics the tool can collect and display go to out Green Metrics Frontend
Documentation
To see the the documentation and how to install and use the tool please go to Green Metrics Tool Documentation
Comparison with other tools
What GMT is not
- GMT is not a real time monitoring system -> Use ProcPower for this
- GMT is not a LoC optimization system -> Use classic debuggers for this
What GMT is great at
- Comparing software implementations
- How much does algorithm A save in carbon vs. Algorithm B
- How much dies Inferencing with LLama 2 cost in carbon vs. LLama 3.1
- ...
- Comparing architectures of whole software systems against each other on service/container level
- How much do I save with a micoservice approach vs. a monolith architecture?
- How much does MySQL consume in carbon vs. PostgreSQL
- ...
- Understanding the life-cycle of an application
- Are my emissions rather in CI/CD testing or in development or in running our VM fleet? (See also CarbonDB for this)
- How much do my Docker builds cost vs. running the application?
- How much does the training of my AI model cost vs. Inferencing?
- Tracking and evaluating code sustainability targets
- How do my carbon emissions for a given software feature develop over time? Are we getting better or worse?
- Which commit has led to an energy / carbon regression
And so much more! See the documentation!
Energy ID Scorecards
Details: Energy ID project page
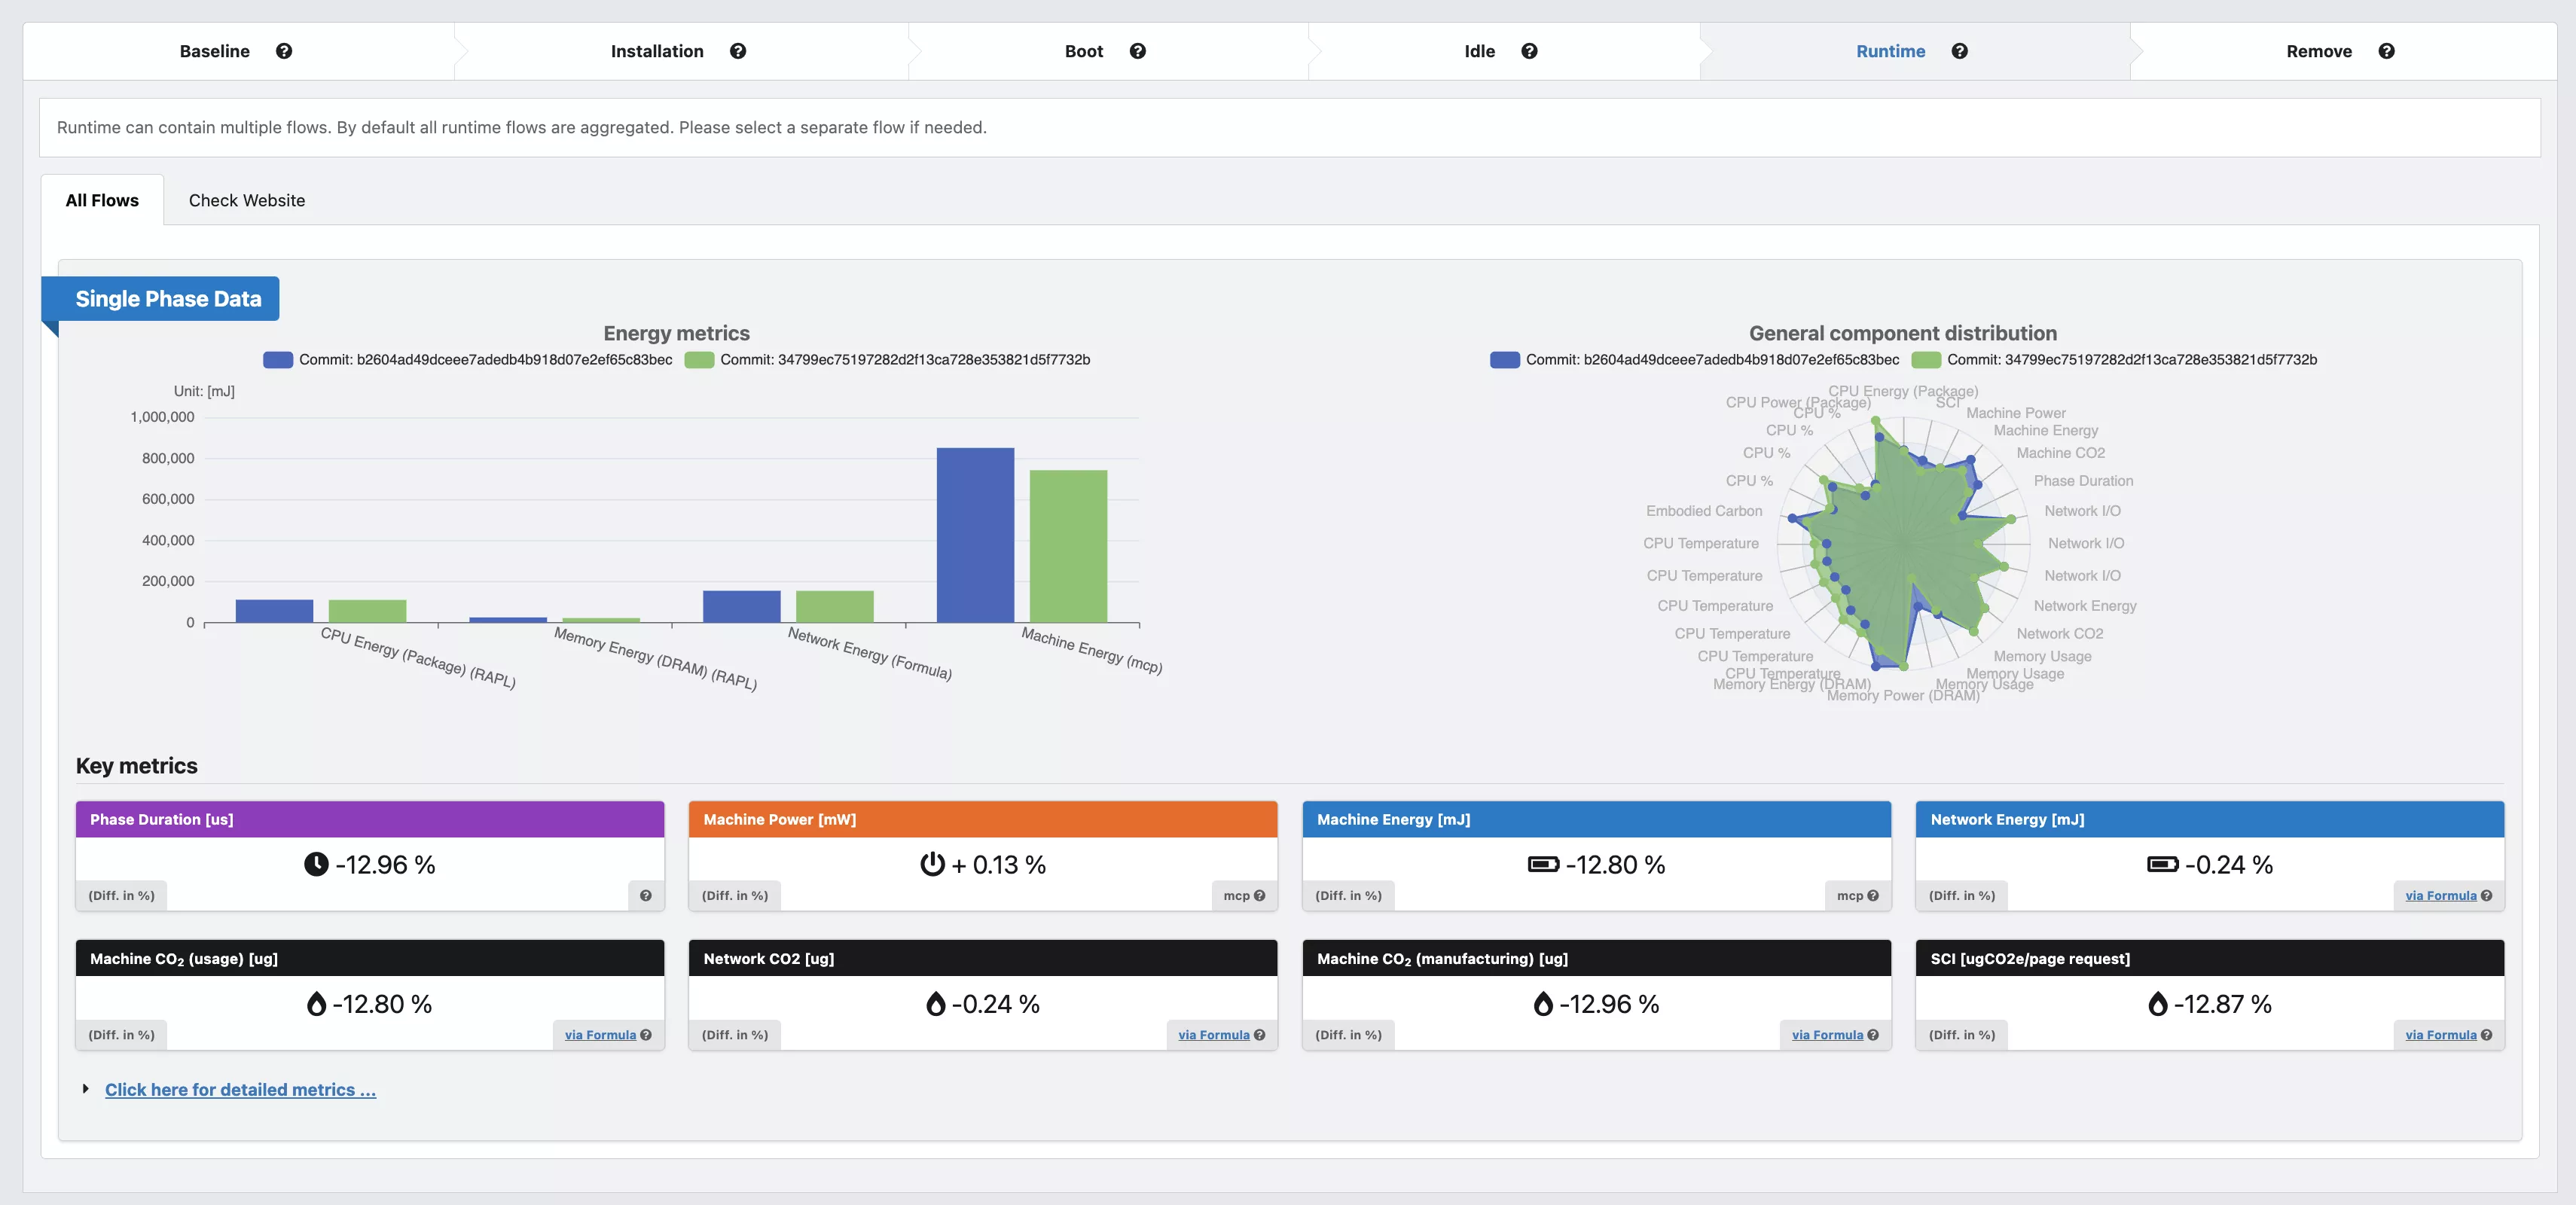
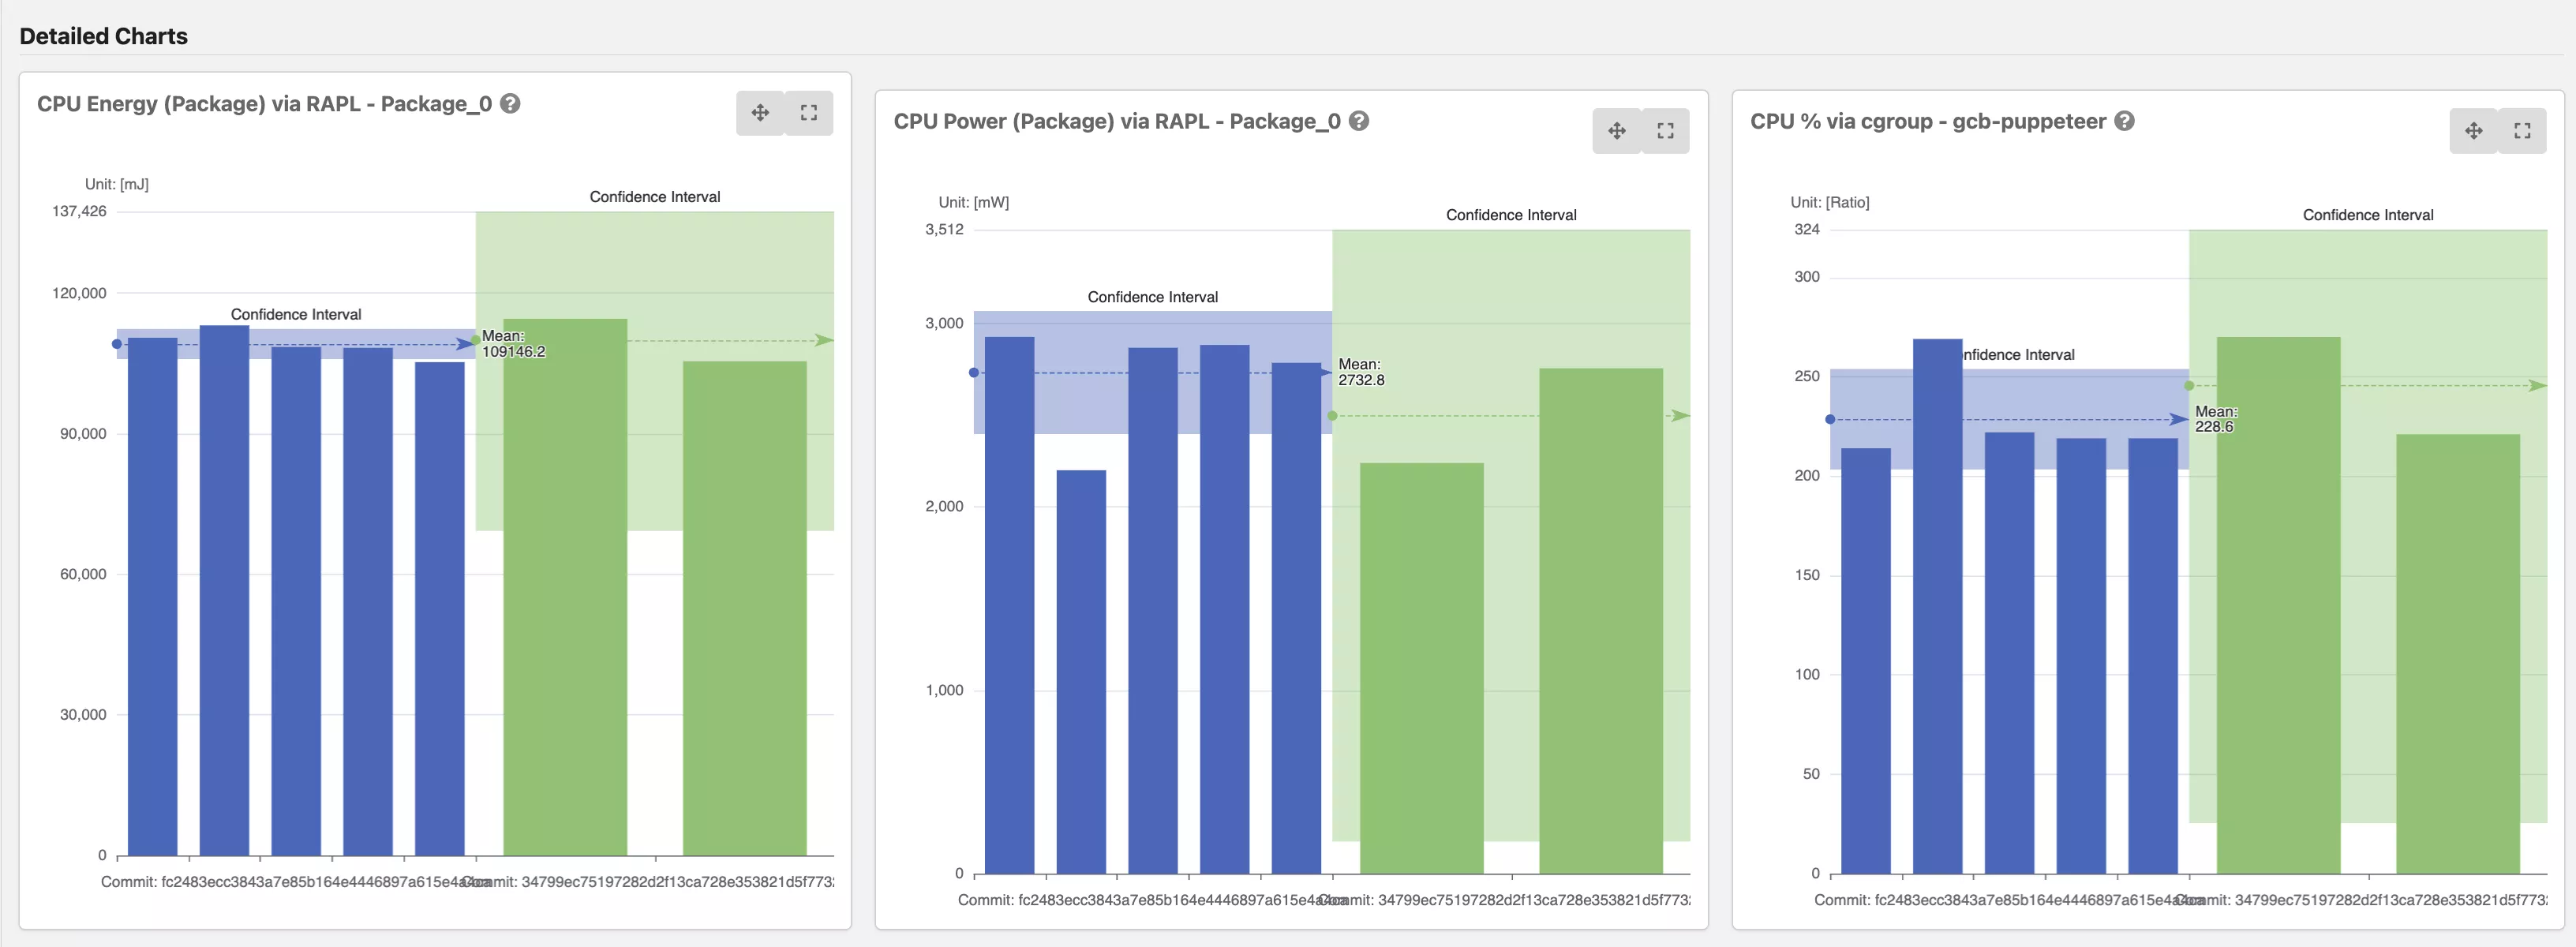
Screenshots of Single Run View
Screenshots of Comparison View
Supporting Repos
- A collection of tools we often use to set things up or debug: https://github.com/green-coding-solutions/tools
- Littel scripts that make working with the GMT easier: https://github.com/green-coding-solutions/gmt-helpers
License and Copyright
The Green Metrics Tool is available under open-source AGPL and commercial license agreements. If you determine you cannot meet the requirements of the AGPL, please contact Green Coding Solutions for more information regarding a commercial license.
Citation (CITATION.cff)
cff-version: 1.2.0
title: Green Metrics Tool
message: >-
  If you use this software, please cite it using the
  metadata from this file.
type: software
authors:
  - given-names: Arne
    family-names: Tarara
    email: arne@green-coding.io
    affiliation: Green Coding Solutions GmbH
  - given-names: Dan
    family-names: Mateas
    email: dan@green-coding.io
    affiliation: Green Coding Solutions GmbH
  - given-names: Geerd-Dietger
    family-names: Hoffmann
    email: didi@green-coding.io
    affiliation: Green Coding Solutions GmbH
repository-code: 'https://github.com/green-coding-solutions/green-metrics-tool'
url: 'https://www.green-coding.io/'
repository: 'https://github.com/green-coding-solutions/'
abstract: >-
  The Green Metrics Tool is a developer tool indented for
  measuring the energy and CO2 consumption of software
  through a software life cycle analysis (SLCA).
keywords:
  - Green Coding
  - 'Software Life Cycle Assessment '
license: AGPL-3.0-or-later
Owner metadata
- Name: Green Coding Solutions
- Login: green-coding-solutions
- Email:
- Kind: organization
- Description: We create open source tools to measure software energy consumption
- Website: https://www.green-coding.io
- Location: Germany
- Twitter:
- Company:
- Icon url: https://avatars.githubusercontent.com/u/97227681?v=4
- Repositories: 47
- Last ynced at: 2024-04-16T05:54:48.943Z
- Profile URL: https://github.com/green-coding-solutions
GitHub Events
Total
- Release event: 5
- Delete event: 410
- Pull request event: 862
- Fork event: 11
- Issues event: 113
- Watch event: 53
- Issue comment event: 851
- Push event: 1355
- Pull request review comment event: 927
- Pull request review event: 413
- Create event: 424
Last Year
- Release event: 3
- Delete event: 187
- Pull request event: 411
- Fork event: 4
- Issues event: 37
- Watch event: 16
- Issue comment event: 379
- Push event: 606
- Pull request review comment event: 178
- Pull request review event: 128
- Create event: 206
Committers metadata
Last synced: 4 days ago
Total Commits: 3,036
Total Committers: 13
Avg Commits per committer: 233.538
Development Distribution Score (DDS): 0.311
Commits in past year: 867
Committers in past year: 6
Avg Commits per committer in past year: 144.5
Development Distribution Score (DDS) in past year: 0.322
| Name | Commits | |
|---|---|---|
| Arne Tarara | a****e@d****e | 2091 |
| dependabot[bot] | 4****] | 585 |
| Didi Hoffmann | 3****a | 127 |
| dan-mm | 3****m | 99 |
| David Kopp | d****p | 46 |
| Danilo Ješić | 3****c | 42 |
| Alexandre | a****o@g****m | 28 |
| Dan M | d****n@g****g | 10 |
| Sai Teja | 4****7 | 3 |
| Mikhail Nachinkin | 1****9 | 2 |
| alexzurbonsen | 8****n | 1 |
| Thilo Ettelt | t****t@n****e | 1 |
| Evanlsmillan | 1****n | 1 |
Committer domains:
- neuland-bfi.de: 1
- green-coding.org: 1
- datafuse.de: 1
Issue and Pull Request metadata
Last synced: 4 days ago
Total issues: 128
Total pull requests: 1,255
Average time to close issues: 9 months
Average time to close pull requests: 5 days
Total issue authors: 15
Total pull request authors: 13
Average comments per issue: 2.44
Average comments per pull request: 1.68
Merged pull request: 955
Bot issues: 1
Bot pull requests: 641
Past year issues: 36
Past year pull requests: 289
Past year average time to close issues: 2 months
Past year average time to close pull requests: 3 days
Past year issue authors: 6
Past year pull request authors: 8
Past year average comments per issue: 2.56
Past year average comments per pull request: 2.52
Past year merged pull request: 171
Past year bot issues: 0
Past year bot pull requests: 126
Top Issue Authors
- ArneTR (52)
- ribalba (40)
- davidkopp (22)
- djesic (2)
- dan-mm (2)
- flyaruu (1)
- schlichtanders (1)
- mrchrisadams (1)
- raits (1)
- clubanderson (1)
- muhamedfazalps (1)
- chrischanwz (1)
- anitaschuettler (1)
- dependabot[bot] (1)
- andracs (1)
Top Pull Request Authors
- dependabot[bot] (641)
- ArneTR (433)
- ribalba (112)
- davidkopp (49)
- winniehell (4)
- Bob-Sideshow (4)
- Lisi4ka59 (3)
- pkutschera (2)
- thiloettelt (2)
- MaximilianJahns (2)
- sufirehman (1)
- flyaruu (1)
- sbenedicadb (1)
Top Issue Labels
- good first issue (19)
- help wanted (17)
- enhancement (12)
- front end (5)
- bug (4)
- idea (1)
- dependencies (1)
- python (1)
- question (1)
Top Pull Request Labels
- dependencies (639)
- python (568)
- docker (58)
- github_actions (13)
- codex (4)
- critical (2)
Dependencies
- ./.github/actions/gmt-pytest * composite
- actions/checkout v3 composite
- green-coding-berlin/eco-ci-activity-checker main composite
- ./.github/actions/gmt-pytest * composite
- actions/checkout v3 composite
- green-coding-berlin/eco-ci-activity-checker main composite
- PyYAML ==6.0
- pandas ==1.5.2
- psycopg2 ==2.9.5
- pydantic ==1.10.2 development
- pylint ==2.15.10 development
- pytest ==7.2.0 development
- requests ==2.25.1 development
- actions/setup-python v4 composite
- docker/login-action v2 composite
- docker/setup-buildx-action master composite
- actions/checkout v3 composite
- docker/login-action v3 composite
- docker/setup-buildx-action v3 composite
- docker/setup-qemu-action v3 composite
- ./.github/actions/gmt-pytest * composite
- actions/checkout v3 composite
- green-coding-berlin/eco-ci-energy-estimation testing composite
- ./.github/actions/gmt-pytest * composite
- actions/checkout v3 composite
- green-coding-berlin/eco-ci-energy-estimation v2 composite
- PyYAML ==6.0.1
- anybadge ==1.14.0
- fastapi ==0.103.1
- gunicorn ==21.2.0
- orjson ==3.9.7
- pandas ==2.1.0
- psycopg ==3.1.10
- schema ==0.7.5
- scipy ==1.11.2
- uvicorn ==0.23.2
- docker/build-push-action v2 composite
- docker/login-action v2 composite
- docker/setup-buildx-action v3 composite
- docker/setup-qemu-action v3 composite
- ./.github/actions/gmt-pytest * composite
- actions/checkout v4 composite
- green-coding-solutions/eco-ci-activity-checker v1 composite
- alpine latest build
- python 3.13-slim build
- postgres 13
- actions/delete-package-versions v5 composite
- Django ==4.2.23 test
- psycopg2-binary ==2.9.10 test
- alpine latest build
- ubuntu latest build
- nestybox/ubuntu-noble-systemd-docker@sha256 8b1c4409fe89bc110e1e468767074fe4403ba6bb2d1b34881fec5df8b6c2f9c3 build
- alpine latest build
- alpine latest build
- alpine latest build
- alpine latest build
Score: 8.327000740241713