PyCINRAD
Decode CINRAD (China New Generation Weather Radar) data and visualize.
https://github.com/CyanideCN/PyCINRAD
Category: Atmosphere
Sub Category: Meteorological Observation and Forecast
Keywords
matplotlib meteorology python radar
Last synced: about 9 hours ago
JSON representation
Repository metadata
Decode CINRAD (China New Generation Weather Radar) data and visualize.
- Host: GitHub
- URL: https://github.com/CyanideCN/PyCINRAD
- Owner: CyanideCN
- License: gpl-3.0
- Created: 2018-06-29T13:52:59.000Z (about 8 years ago)
- Default Branch: master
- Last Pushed: 2026-06-26T10:45:59.000Z (27 days ago)
- Last Synced: 2026-07-14T02:04:48.466Z (10 days ago)
- Topics: matplotlib, meteorology, python, radar
- Language: Python
- Homepage: https://pycinrad.cn/
- Size: 39.4 MB
- Stars: 430
- Watchers: 27
- Forks: 169
- Open Issues: 11
- Releases: 28
-
Metadata Files:
- Readme: README.md
- License: LICENSE
README.md
PyCINRAD
![]()
![]()
Decode CINRAD (China New Generation Weather Radar) data and visualize.
To check out live examples and docs, visit pycinrad.cn.
example folder contains detailed examples!
Installation
PyCINRAD supports Python version 3.9 and higher.
pip install cinrad
You can also download from github page and build from source
git clone https://github.com/CyanideCN/PyCINRAD.git
cd PyCINRAD
pip install .
Modules
cinrad.io
Decode CINRAD radar data.
from cinrad.io import CinradReader, StandardData
f = CinradReader(your_radar_file) #Old version data
f = StandardData(your_radar_file) #New standard data (or phased array data)
f.get_data(tilt, drange, dtype) #Get data
f.get_raw(tilt, drange, dtype)
The get_raw method returns radar records without other geographic information.
The get_data method returns xarray.Dataset with radar records, geographic coordinates, and all extra attributes. So, all benefits of xarray can be enjoyed. Check xarray documentation for more detailed explanation.
For example, it's very convenient to save data as netcdf format.
>>> data.to_netcdf('1.nc')
xarray also makes interpolation very convenient.
>>> data.interp(azimuth=np.deg2rad(300), distance=180)
For single-tilt data (i.e. files that contain only one elevation angle), cinrad.io.StandardData.merge can merge these files to a file contains full volumetric scan.
Export data to Py-ART defined class
Convert data structure defined in this module into pyart.core.Radar is very simple. cinrad.io.export has a function standard_data_to_pyart, which can take cinrad.io.StandardData as input and return pyart.core.Radar as output.
example folder contains a simple demo about this.
Decode PUP data and SWAN data
cinrad.io.StandardPUP provides functions to decode Standard PUP(rose) data. The extracted data can be further used to create PPI.
cinrad.io.SWAN provides similar interface to decode SWAN data.
from cinrad.io import StandardPUP
f = StandardPUP(your_radar_file)
data = f.get_data()
Decode phased array radar data
cinrad.io.PhasedArrayData provides similar interface to decode level 2 data from phased array radar with old format.
from cinrad.io import PhasedArrayData
f = PhasedArrayData(your_radar_file)
data = f.get_data(0, 40, 'REF')
cinrad.utils
This submodule provides some useful algorithms in radar meteorology. All functions only accept numpy.ndarray as input data. This submodule extends the usage of this program, as these functions can accept customized data rather than only the data decoded by cinrad.io.
cinrad.calc
For direct computation of decoded data, cinrad.calc provides functions that simplify the process of calculation. For functions contained in this submodule, only a list of reflectivity data is required as the argument.
Code to generate the required list:
r_list = [f.get_data(i, 230, 'REF') for i in f.angleindex_r]
# or
r_list = list(f.iter_tilt(230, 'REF'))
VCS
cinrad.calc.VCS provides calculation of vertical cross-section for all variables.
import cinrad
from cinrad.visualize import Section
f = cinrad.io.CinradReader(your_radar_file)
rl = [f.get_data(i, 230, 'REF') for i in f.angleindex_r]
vcs = cinrad.calc.VCS(rl)
sec = vcs.get_section(start_cart=(111, 25.5), end_cart=(112, 26.7)) # pass geographic coordinates (longitude, latitude)
sec = vcs.get_section(start_polar=(115, 350), end_polar=(130, 30)) # pass polar coordinates (distance, azimuth)
fig = Section(sec)
fig('D:\\')
Radar mosaic
cinrad.calc.GridMapper can merge different radar scans into a cartesian grid, also supports CR.
Hydrometeor classification
cinrad.calc.hydro_class uses algorithm suggested by Dolan to classify hydrometeors into 10 categories. (Requires REF, ZDR, RHO, and KDP)
cinrad.correct
This submodule provides algorithms to correct raw radar fields.
cinrad.correct.dealias
This function can unwrap the folded velocity using algorithm originated from pyart. (needs C compiler)
import cinrad
#(some codes omitted)
v = f.get_data(1, 230, 'VEL')
v_corrected = cinrad.correct.dealias(v)
cinrad.visualize
Visualize the data stored in acceptable format (cinrad.datastruct). It also means that you can using customized data to perform visualization, as long as the data is stored as xarray.Dataset and constructed by the same protocol (variables naming conventions, data coordinates and dimensions, etc.) For further information about this method, please see the examples contained in example folder.
from cinrad.visualize import PPI
fig = PPI(R) #Plot PPI
fig('D:\\') #Pass the path to save the fig
from cinrad.visualize import Section
fig = Section(Slice_) #Plot VCS
fig('D:\\')
The path passed into the class can either be the folder path or the file path. Also, if no path is passed, the figure will be saved at the folder named PyCINRAD in the home folder (e.g. C:\Users\tom).
Customize plot settings
The summary of args that can be passed into PPI are listed as follows.
| arg | function |
|---|---|
cmap |
colormaps used for plotting |
norm |
norm used for plotting |
nlabel |
number of labels on the colorbar |
label |
labels on the colorbar |
highlight |
highlight area of input name |
dpi |
dpi of figure |
extent |
area to plot e.g. extent=[90, 91, 29, 30] |
section |
cross-section data to ppi plot |
style |
background color:black/white/transparent |
add_city_names |
annotate name of city on the plot |
Beside args, class PPI has some other auxiliary plotting functions.
PPI.plot_range_rings(self, _range, color='white', linewidth=0.5, **kwargs)
Plot range rings on the PPI plot.
PPI.plot_cross_section(self, data, ymax=None)
Plot VCS section under the PPI plot.
This function is very similar to vcs argument of class PPI, but the range of y-axis can be adjusted only by this function.
PPI.storm_track_info(self, filepath)
Plot PUP STI product on the current PPI map, including past positions, current position, and forecast positions.
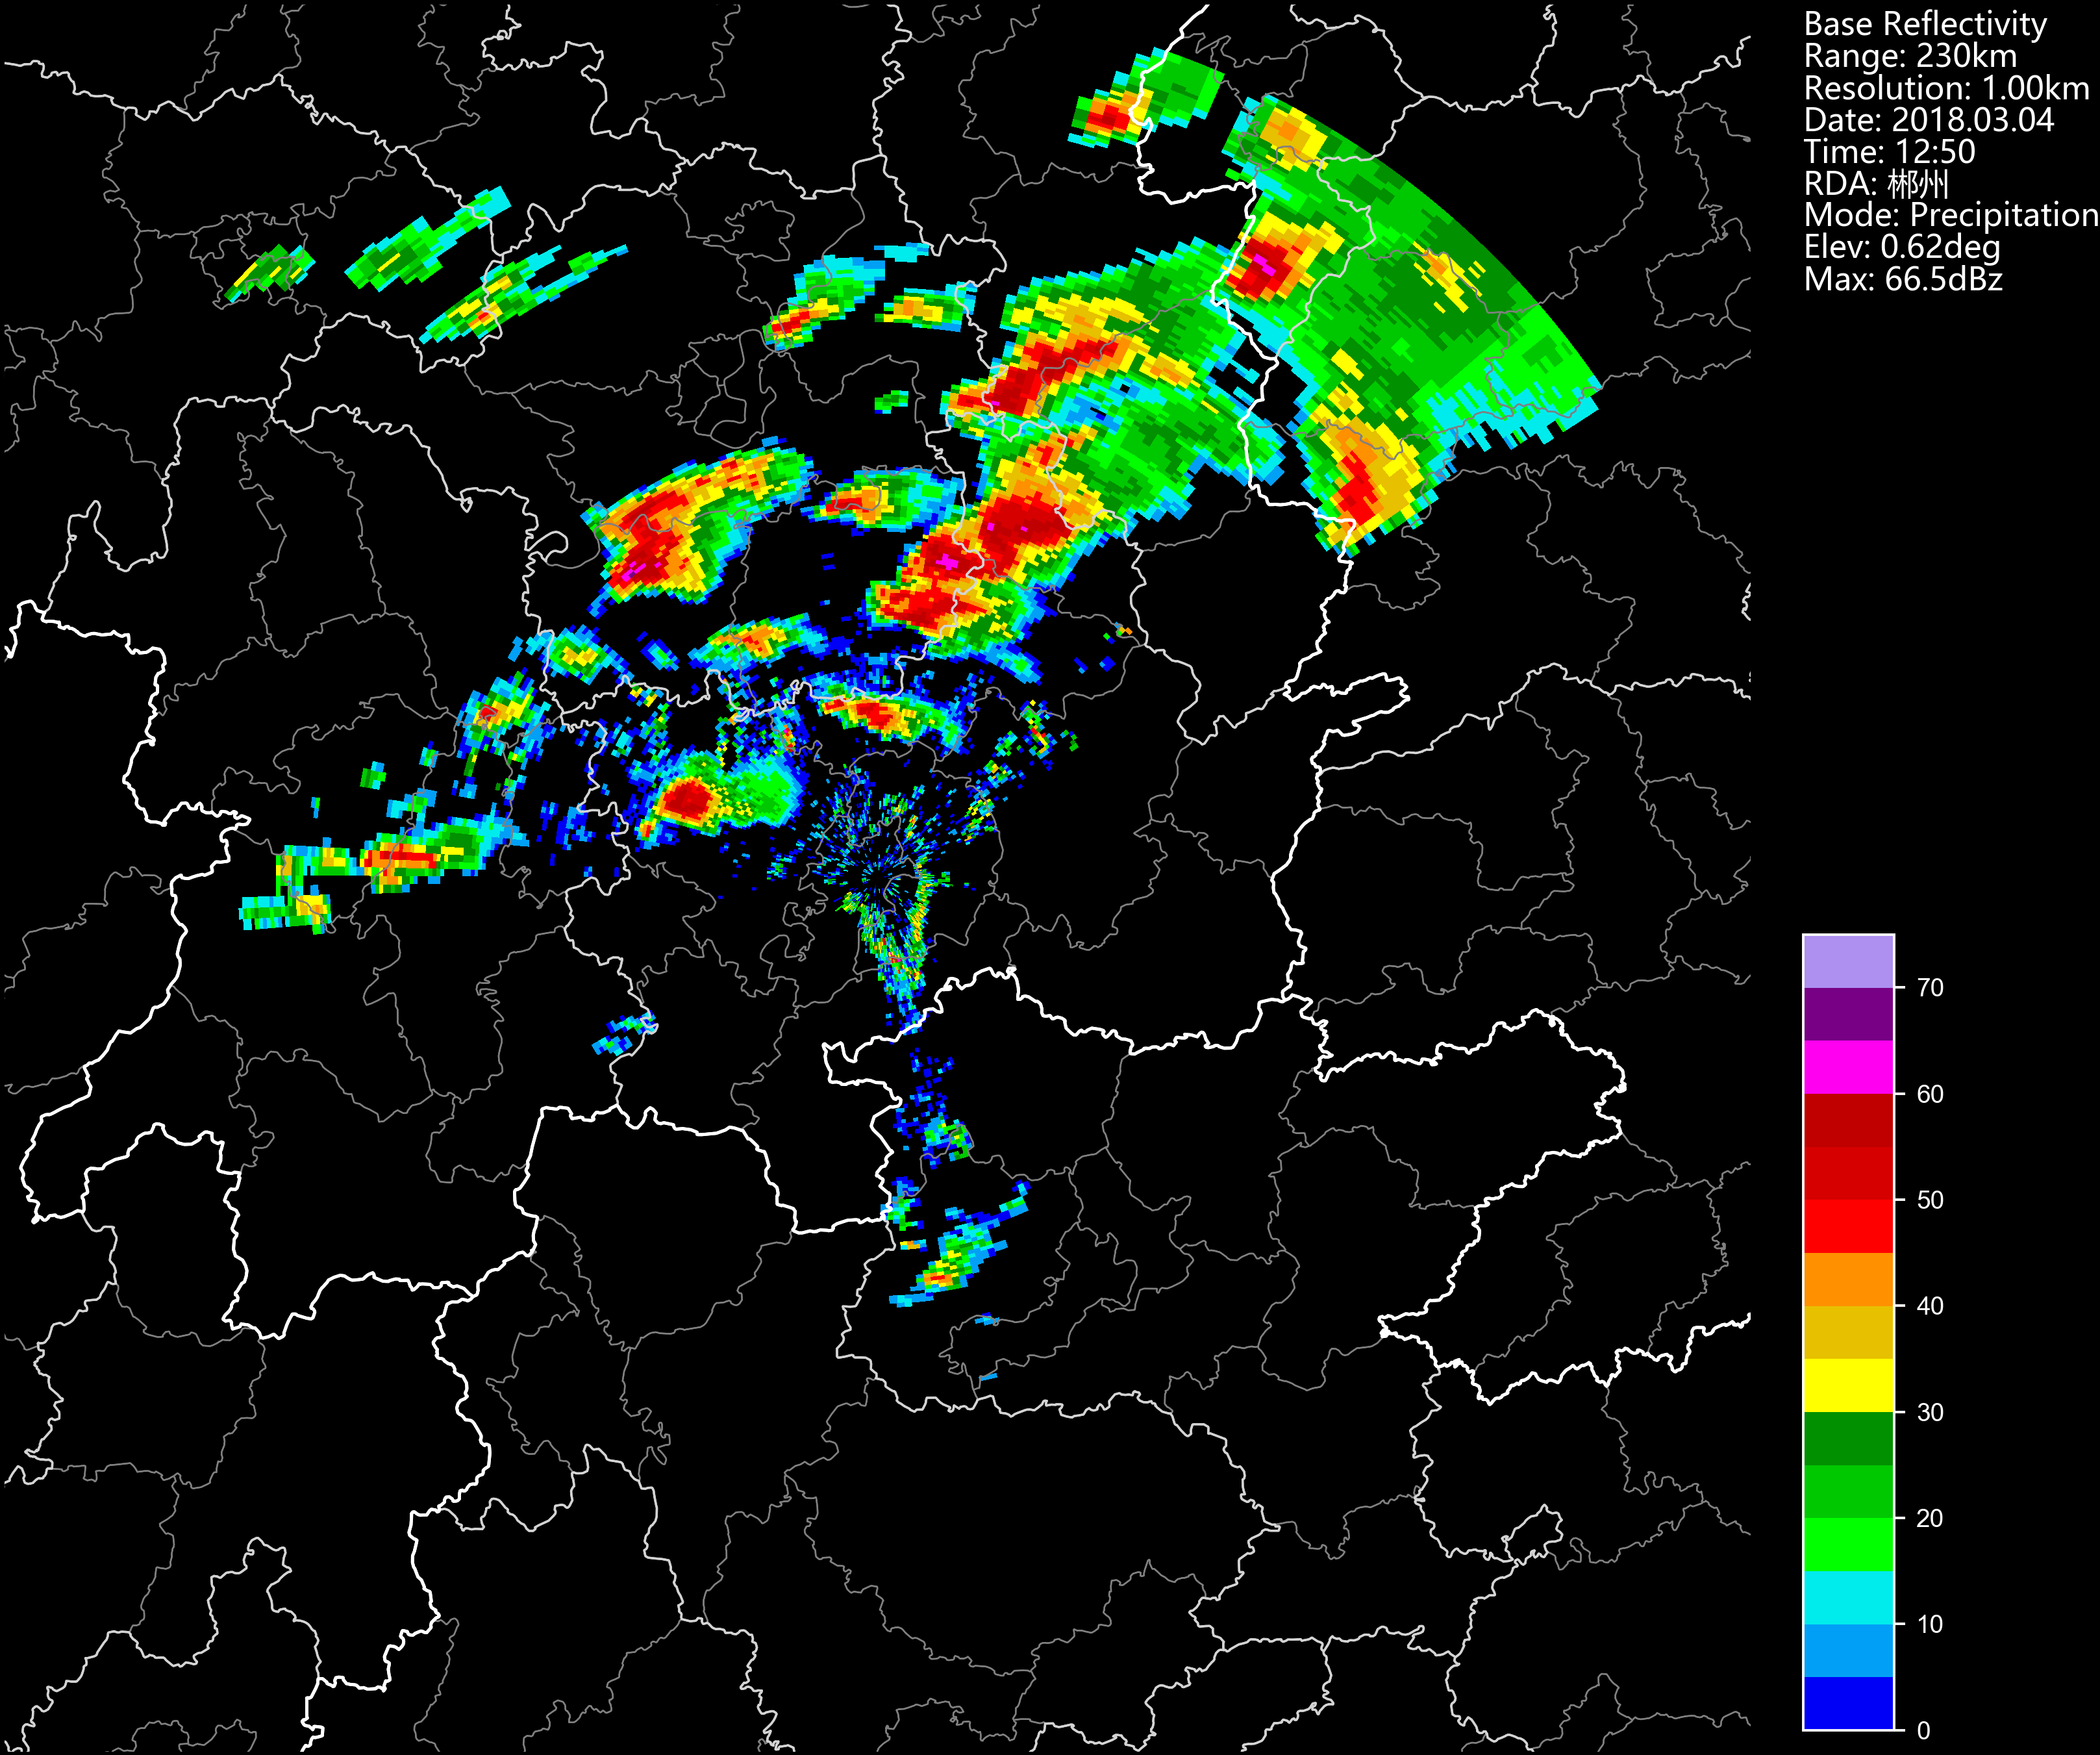
Gallery
PPI reflectivity
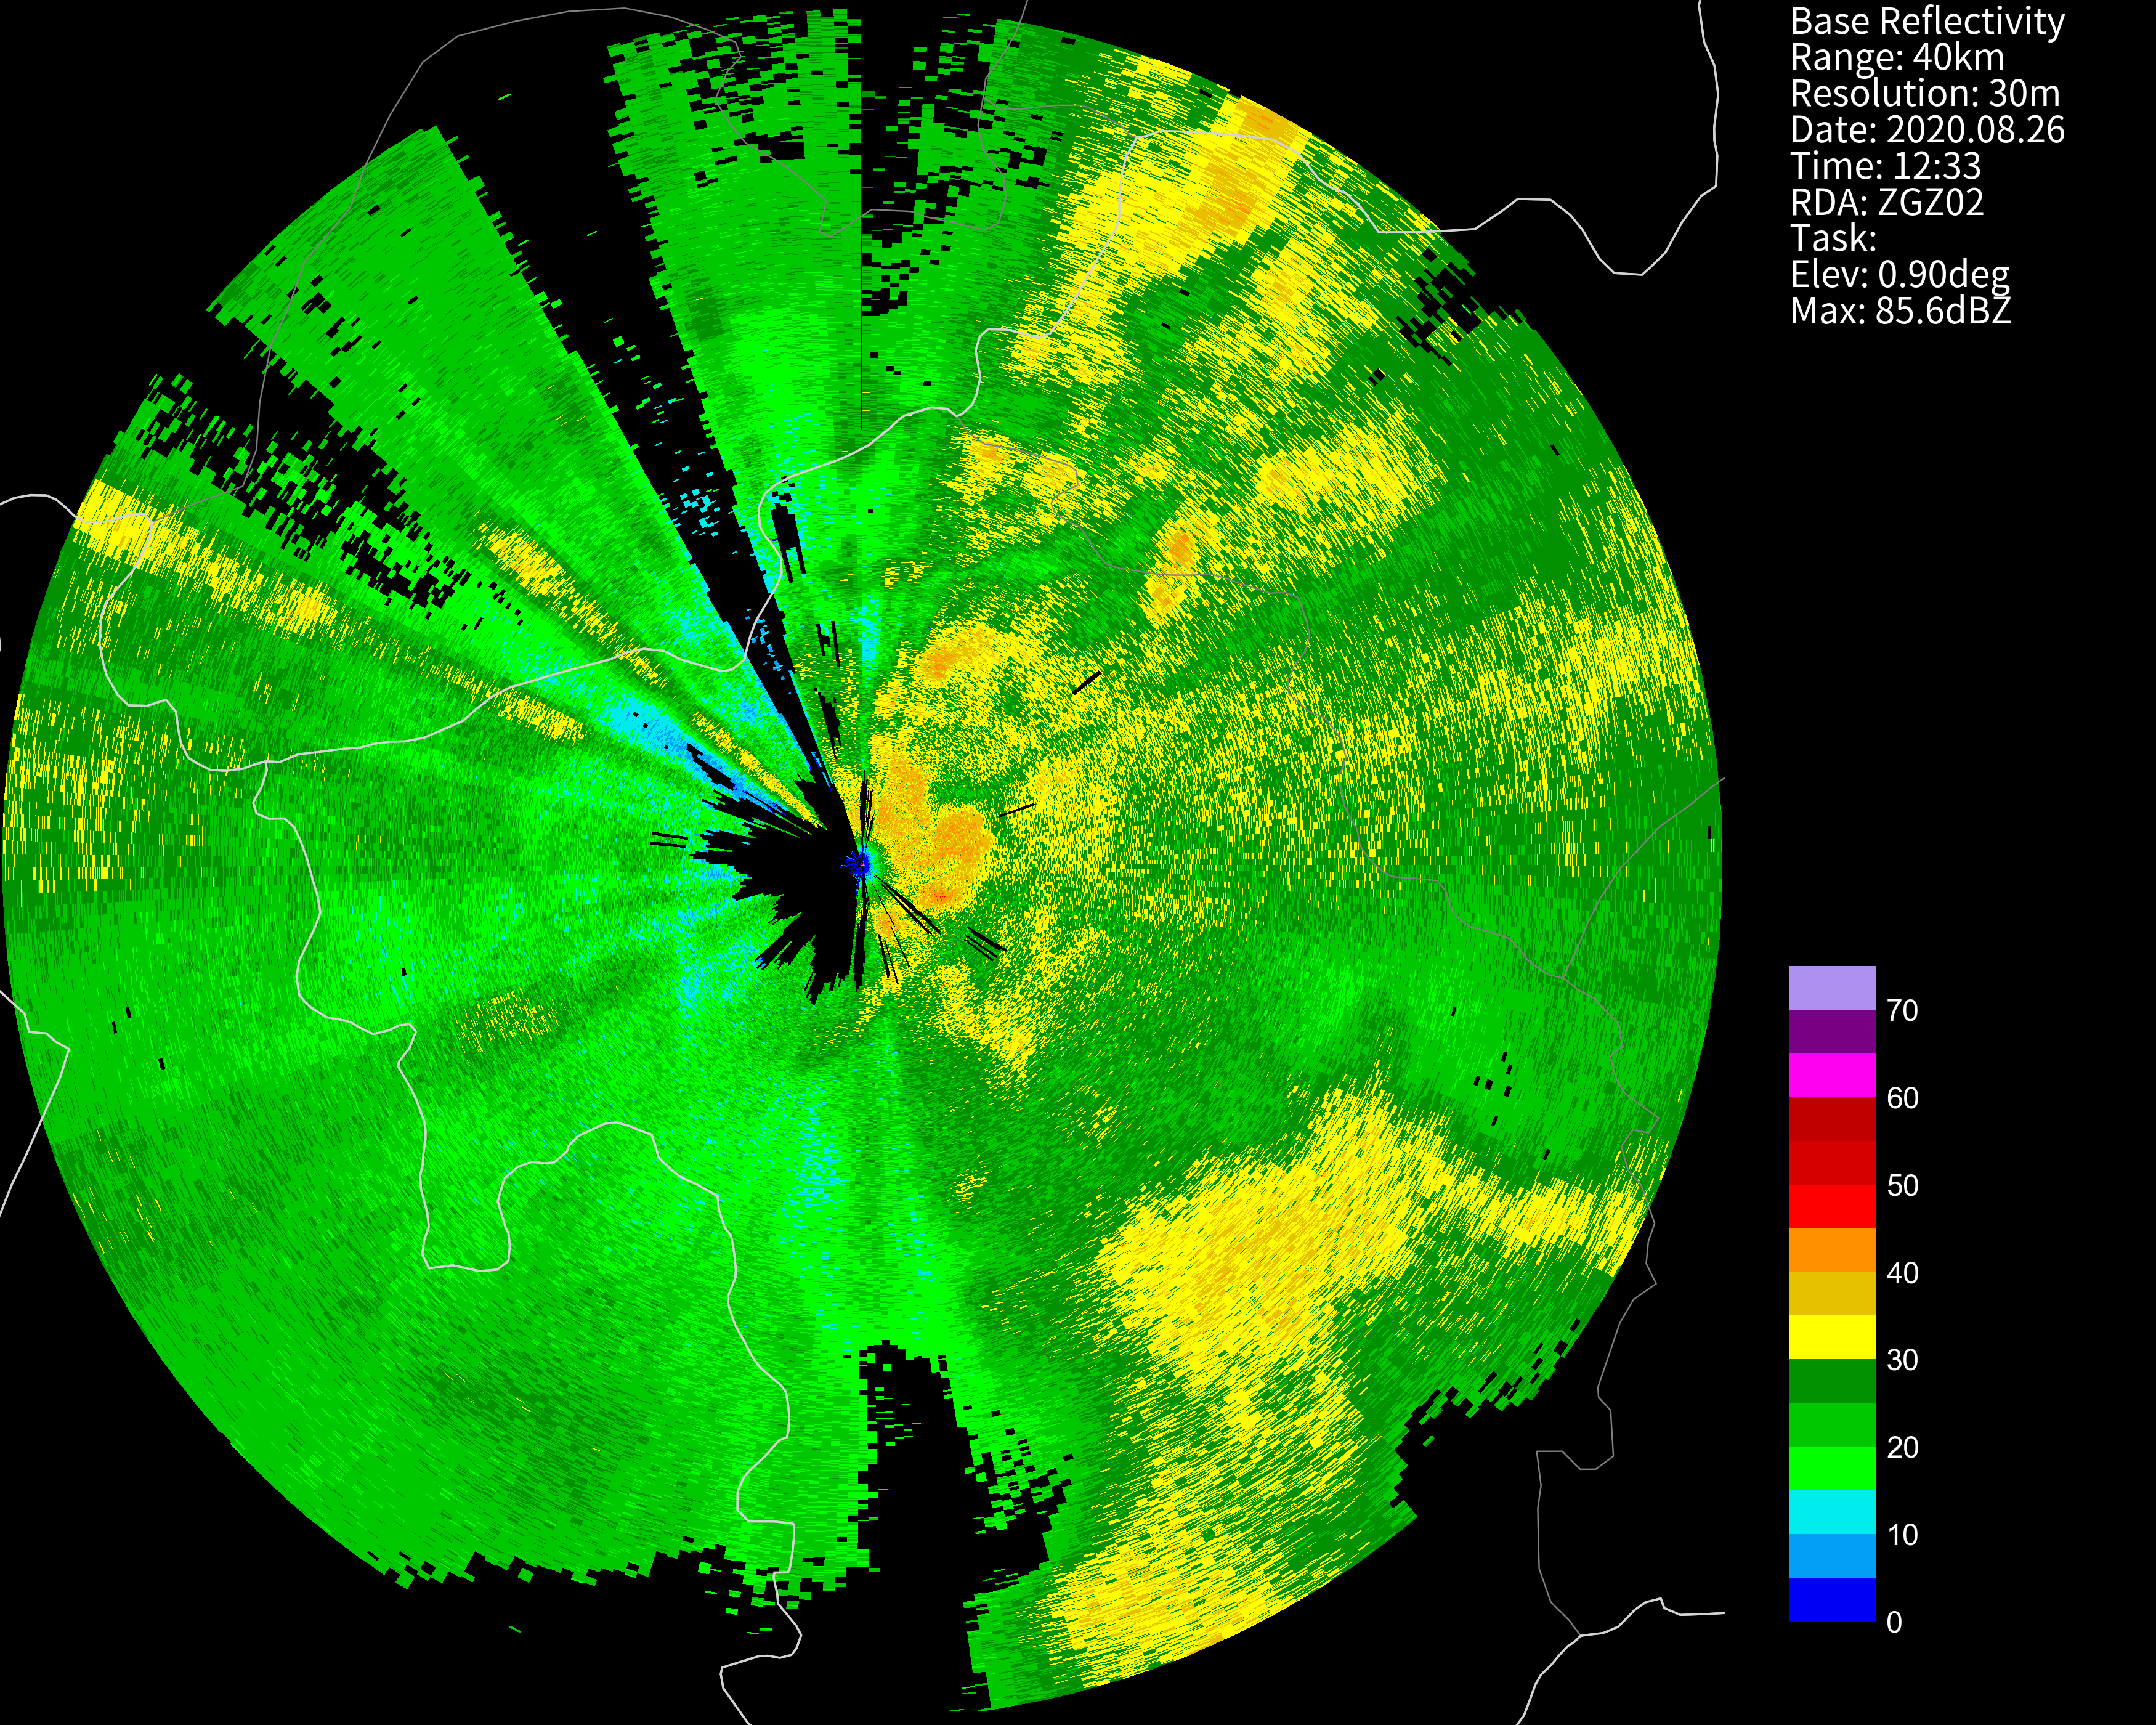
Phased array radar reflectivity
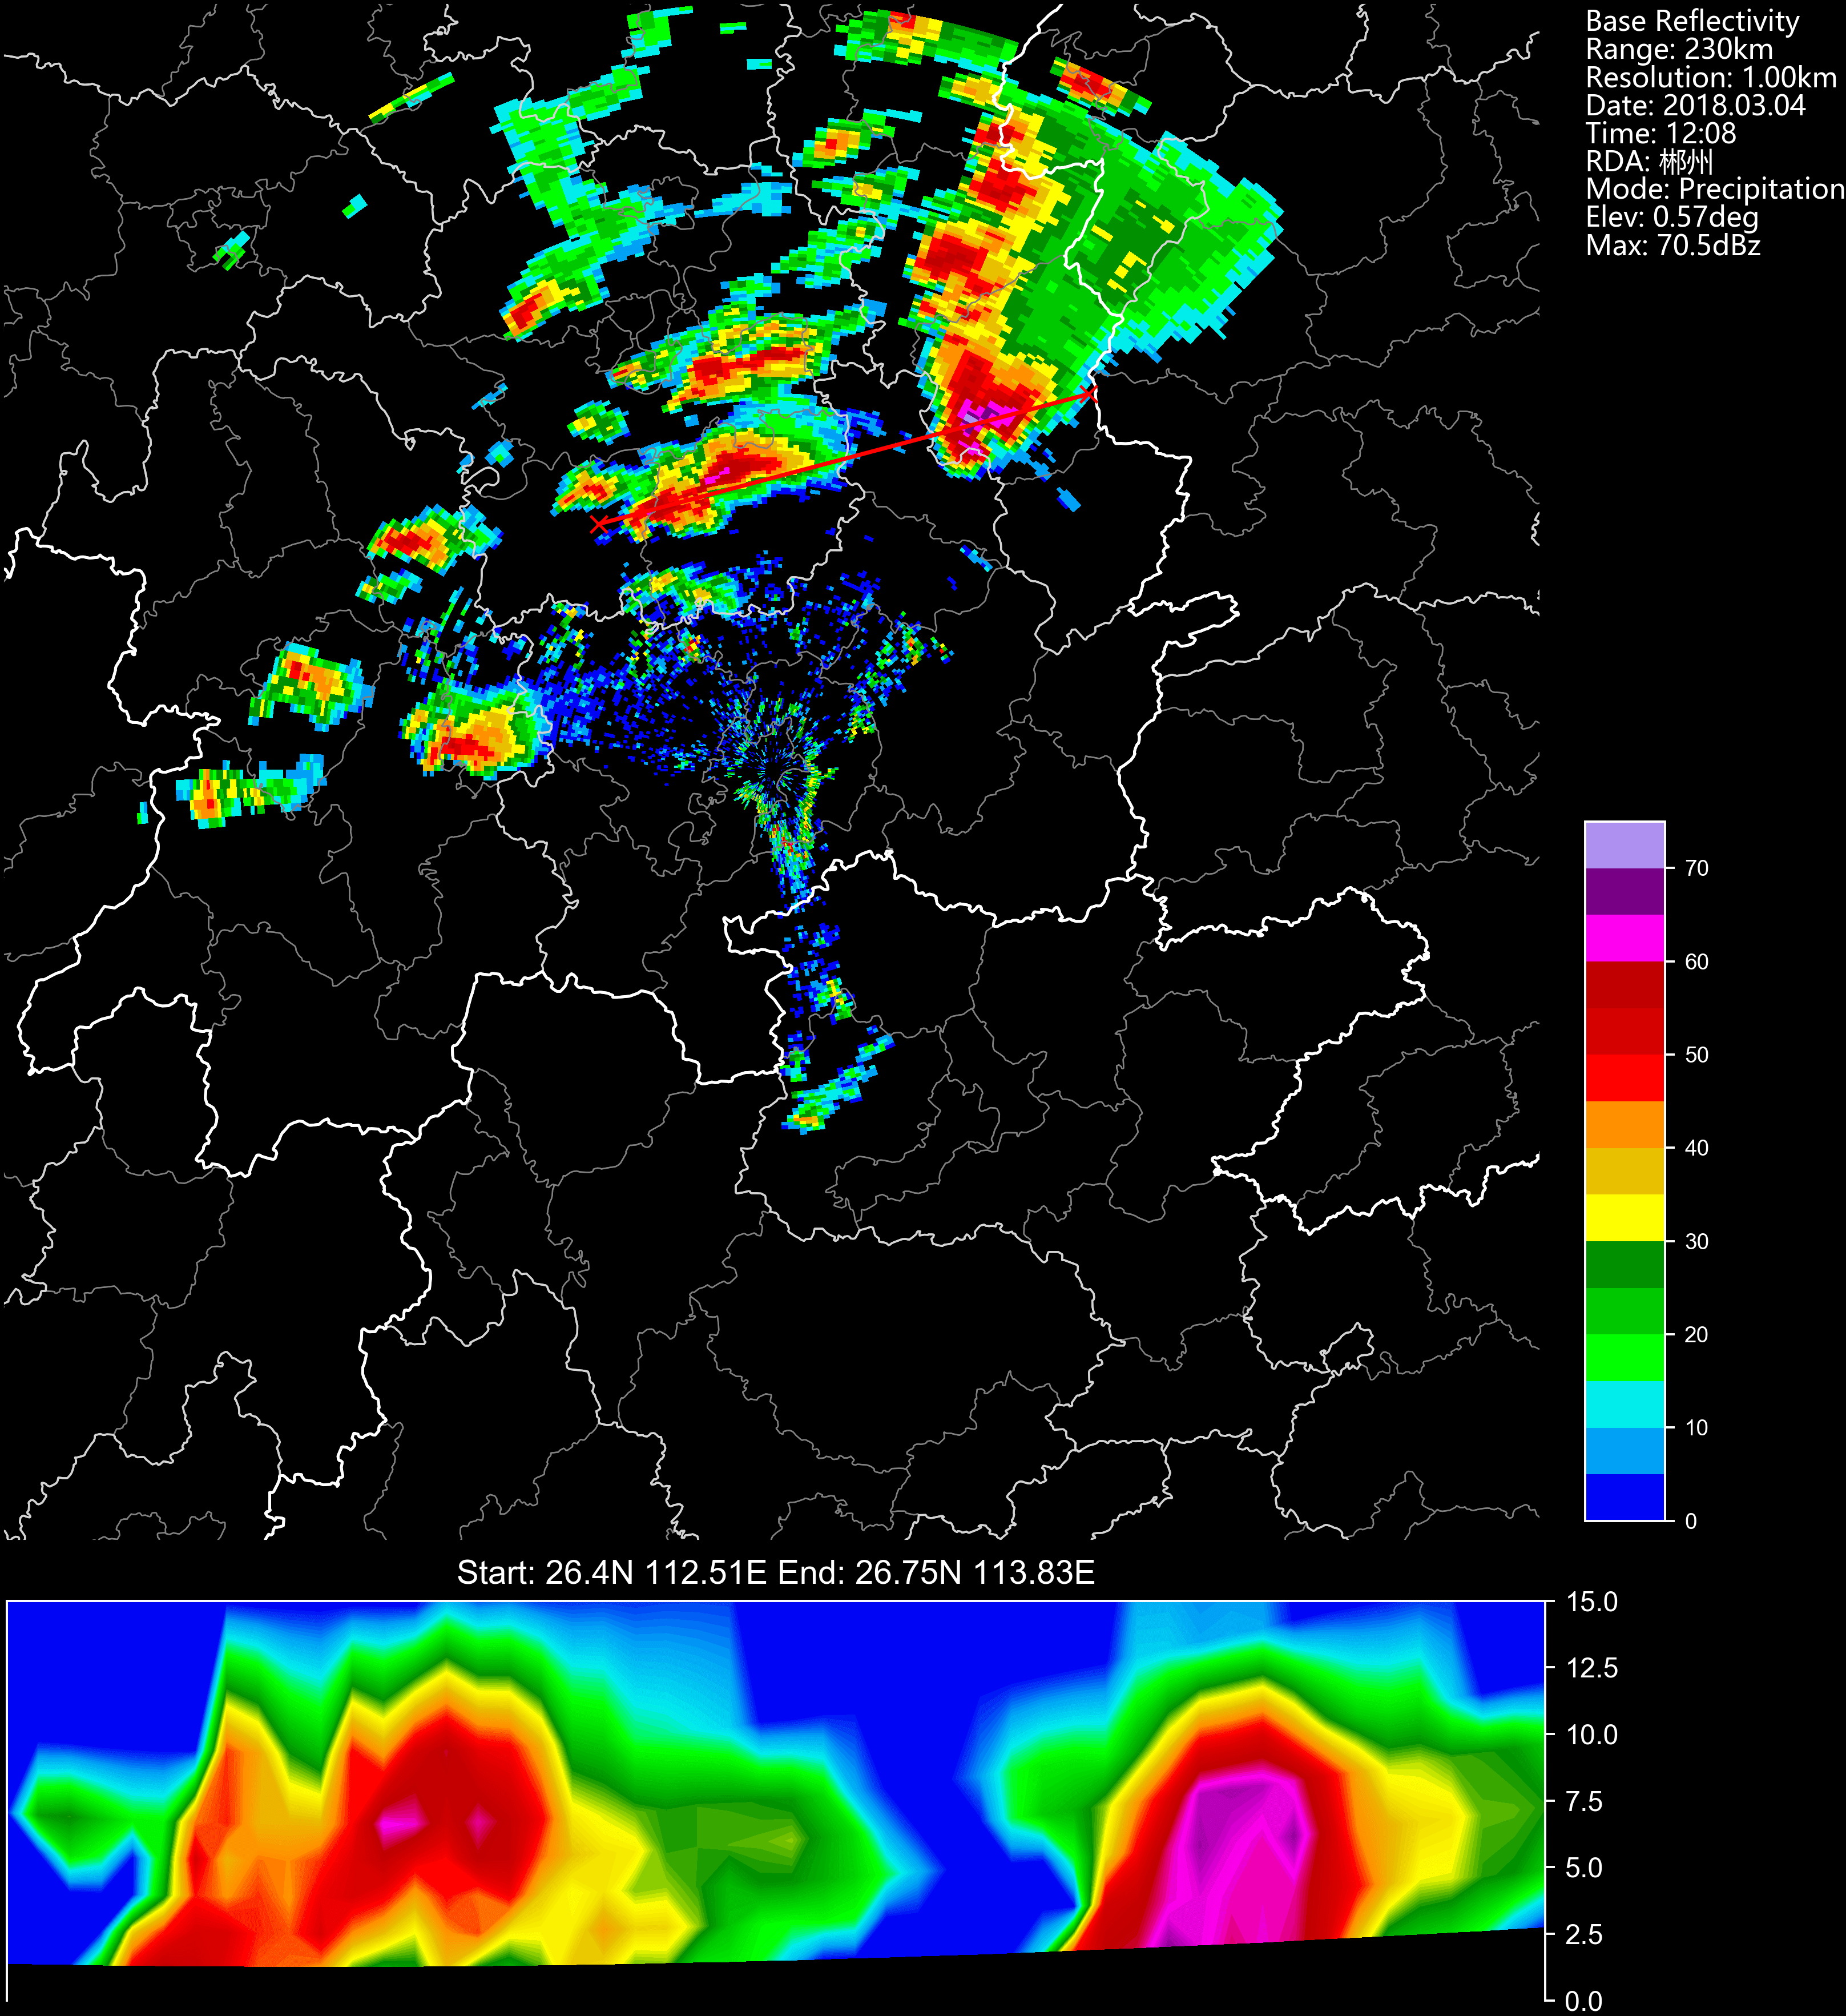
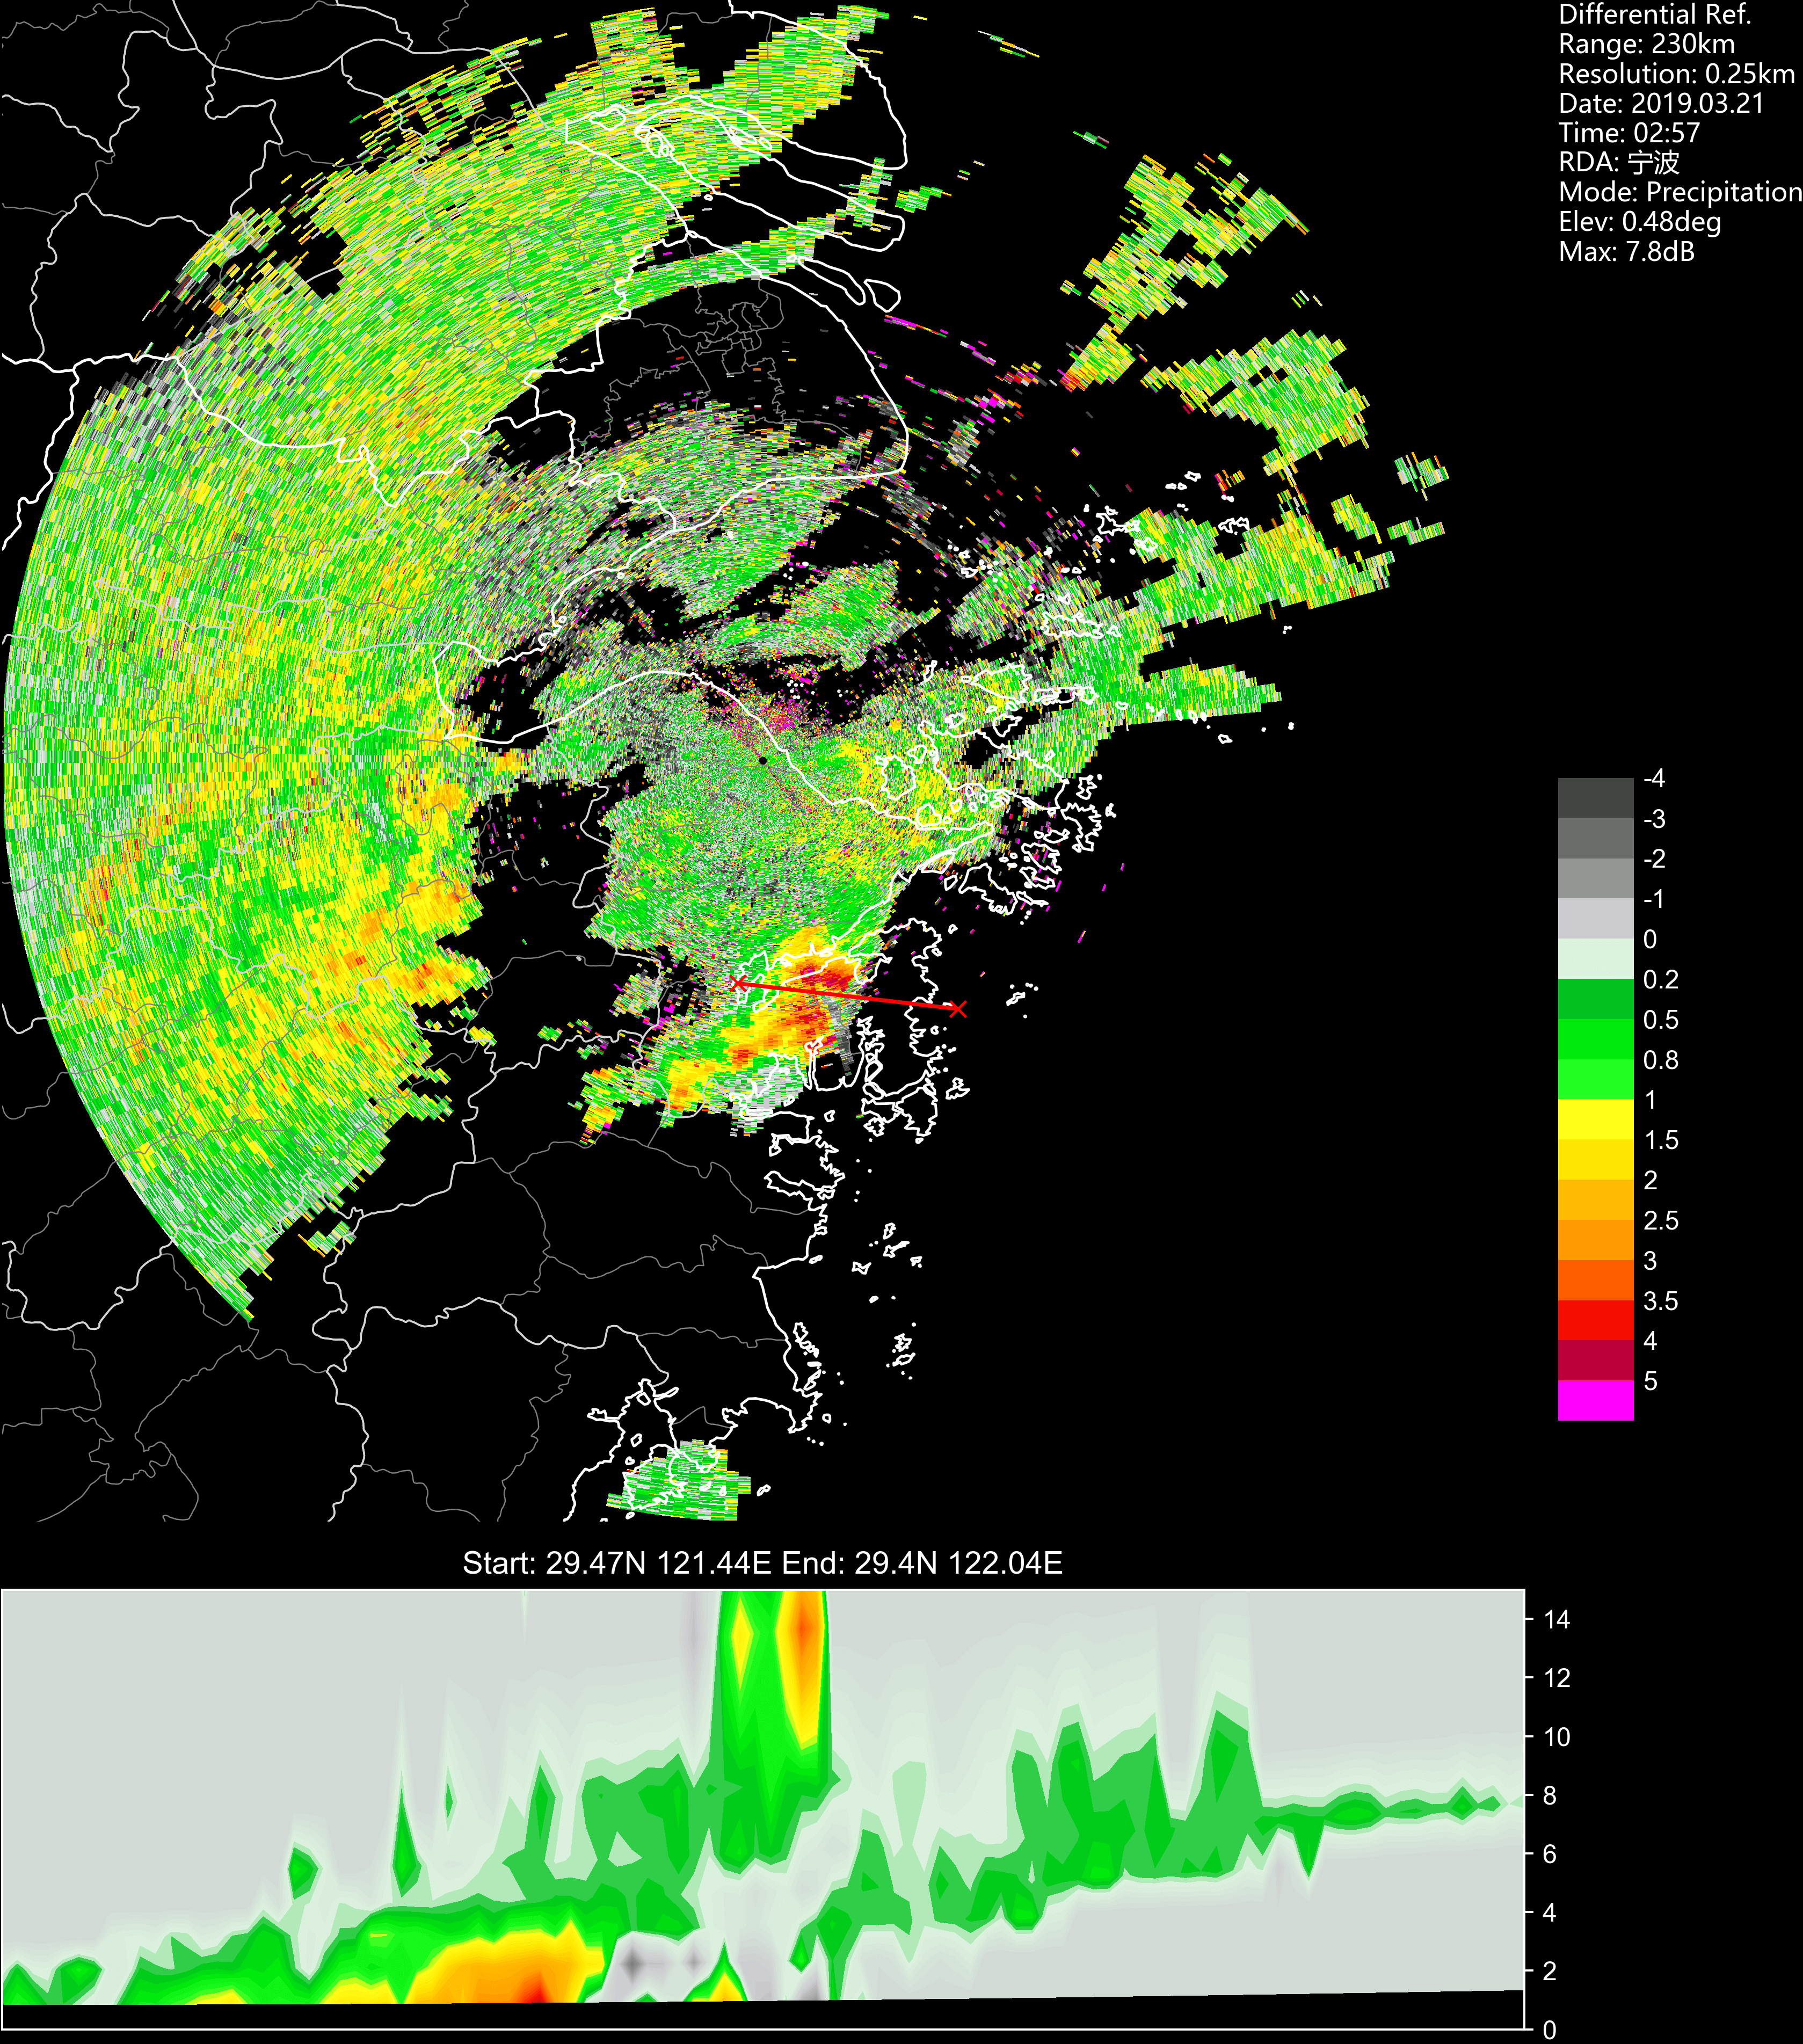
PPI reflectivity combined with cross-section
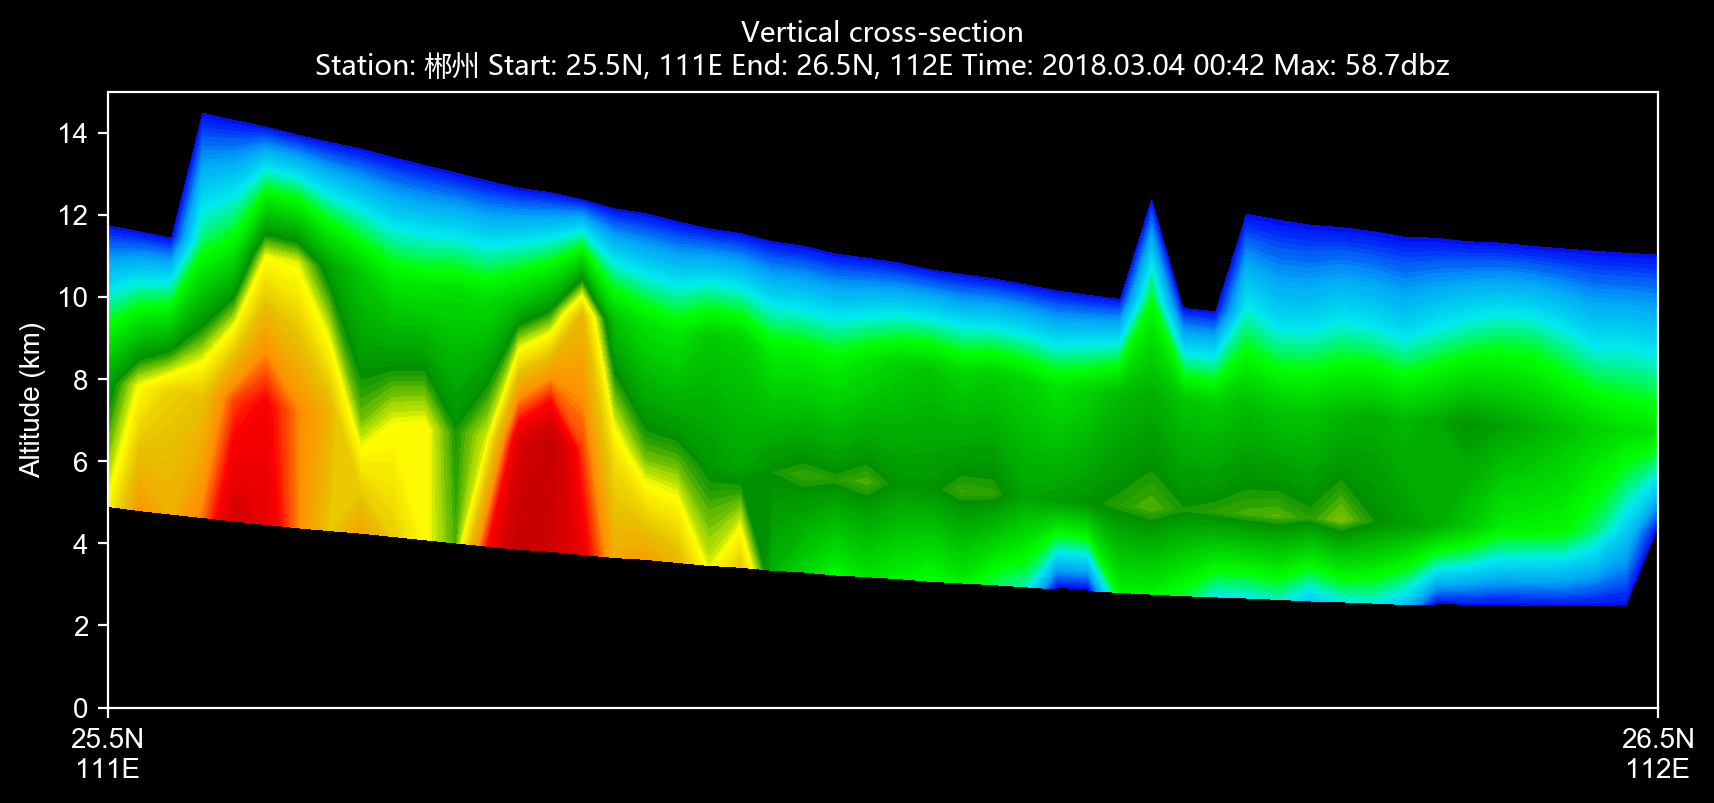
Cross-section
Cross-section other than reflectivity
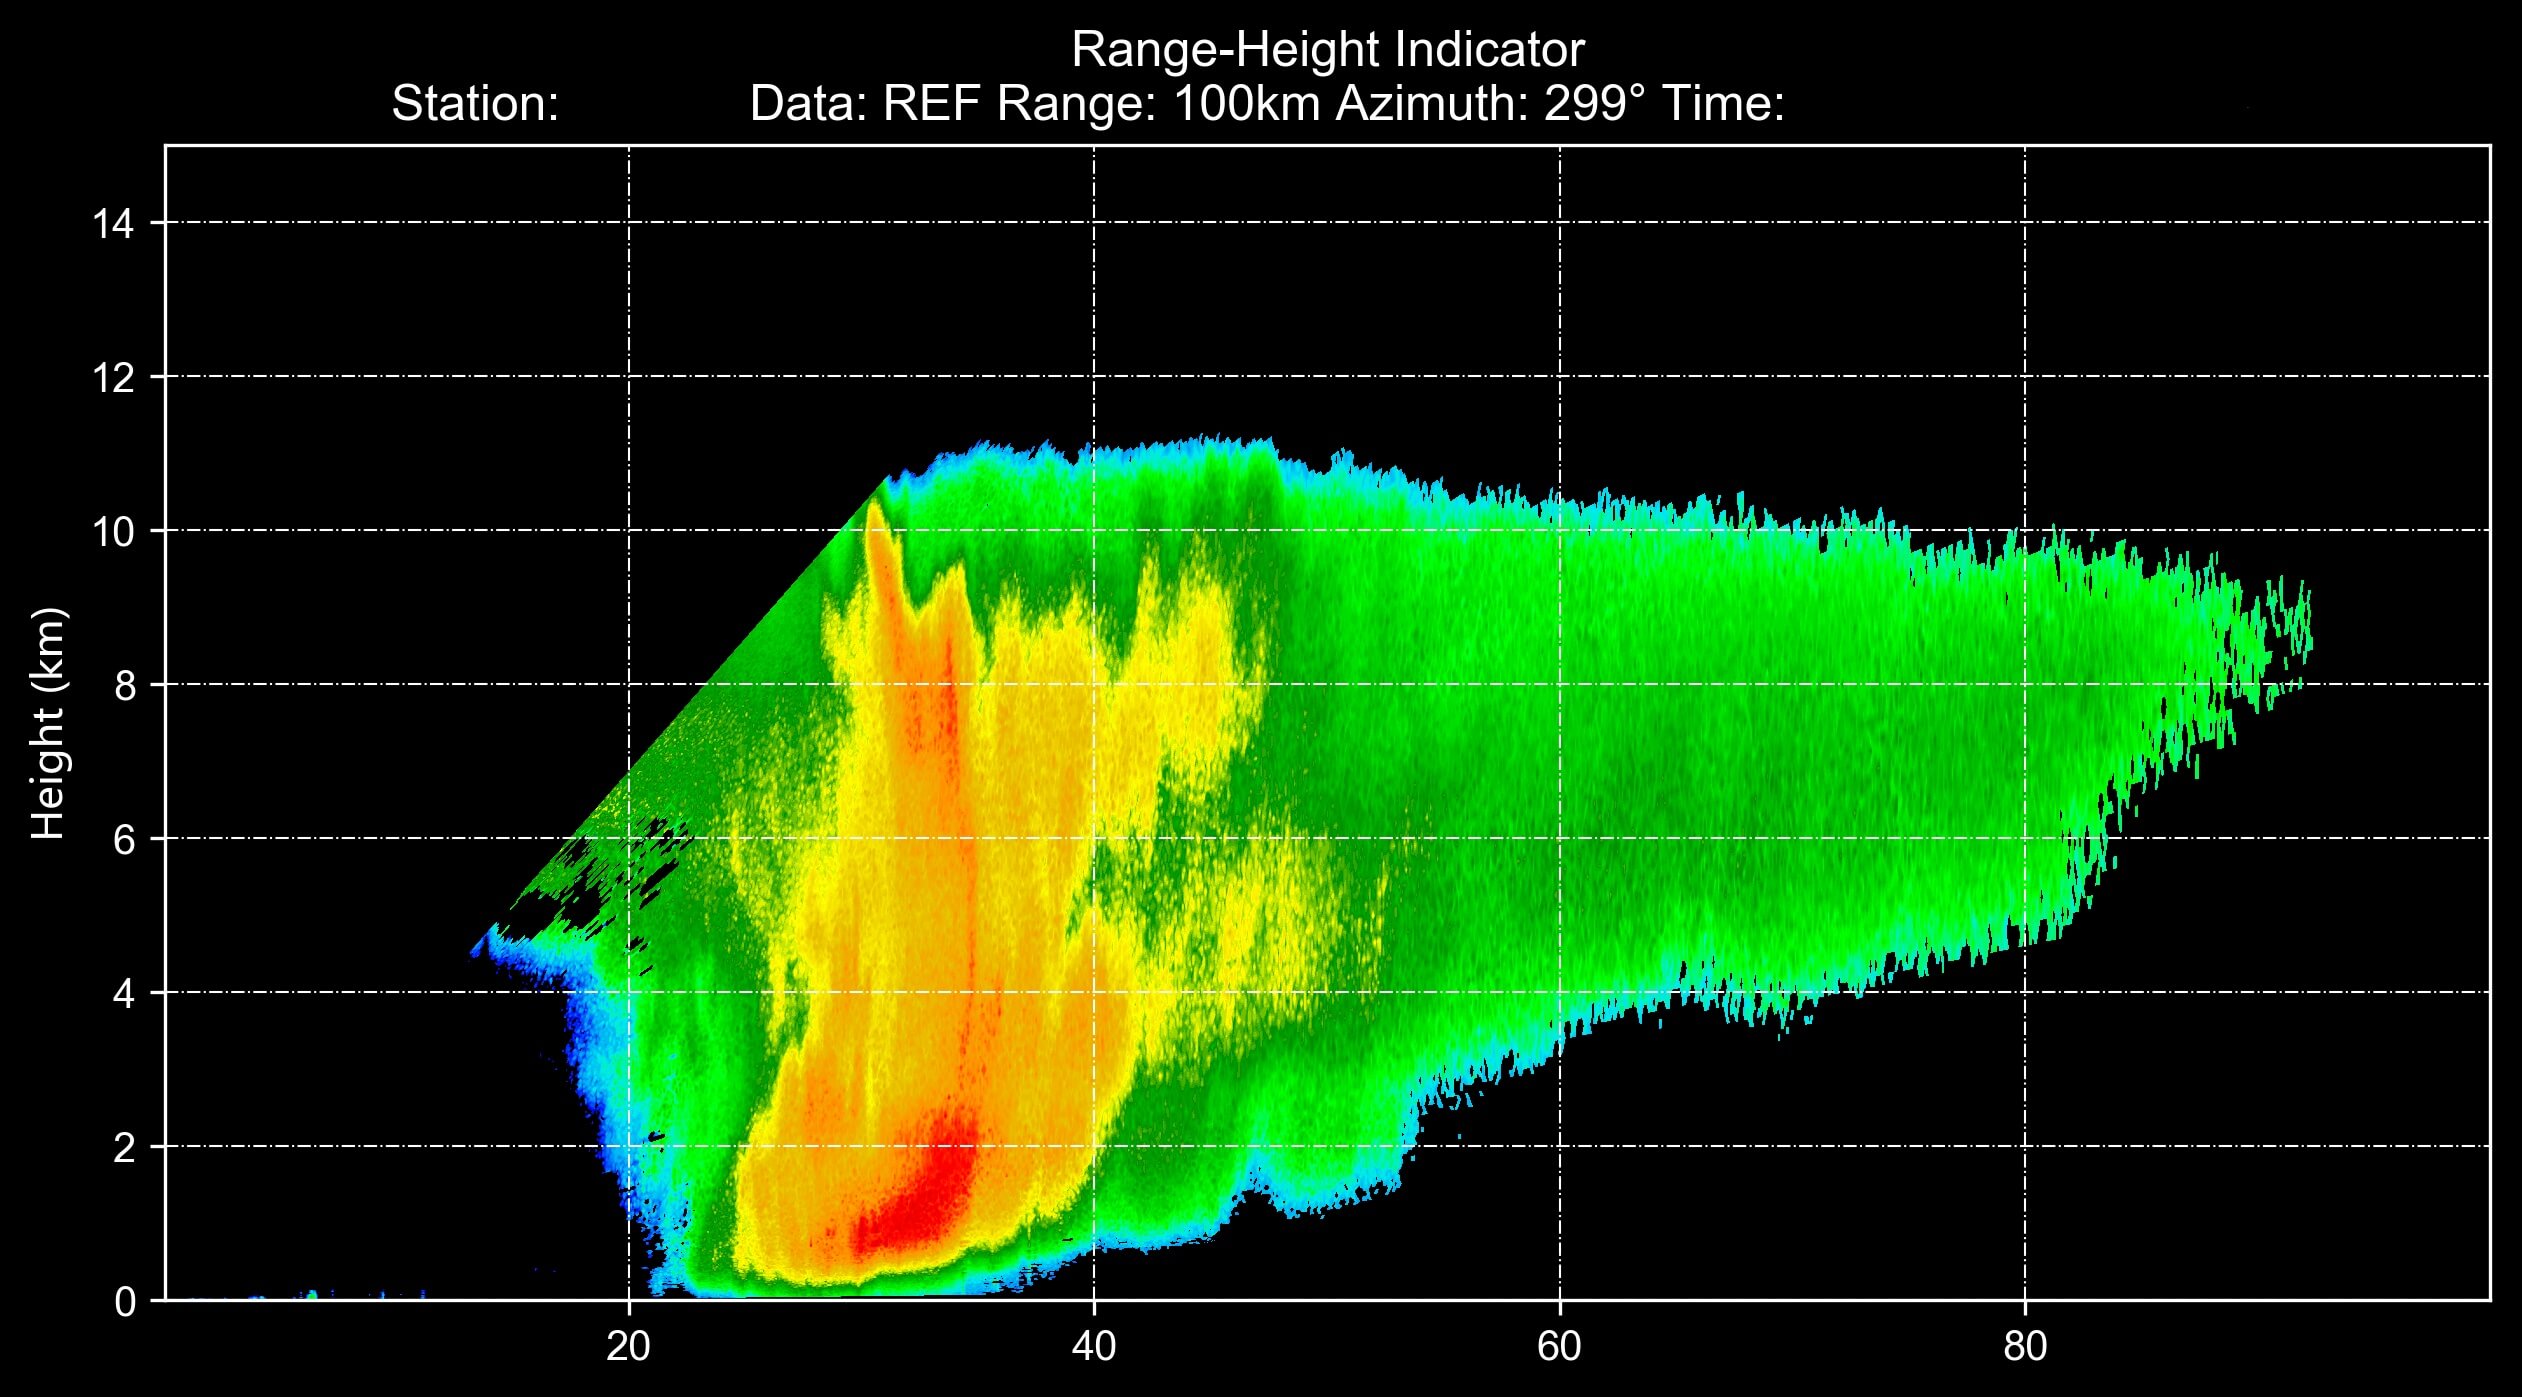
RHI reflectivity
Citation
If you use PyCINRAD in your paper, please cite PyCINRAD using the DOI below.
![]()
Papers that use plots generated by PyCINRAD
- Recognition and Analysis of Biological Echo Using WSR-88D Dual-polarization Weather Radar in Nanhui of Shanghai doi: 10.16765/j.cnki.1673-7148.2019.03.015
Notes
The hydrometeor classfication algorithm comes from Dolan, B., S. A. Rutledge, S. Lim, V. Chandrasekar, and M. Thurai, 2013: A Robust C-Band Hydrometeor Identification Algorithm and Application to a Long-Term Polarimetric Radar Dataset. J. Appl. Meteor. Climatol., 52, 2162–2186, https://doi.org/10.1175/JAMC-D-12-0275.1.
If you are interested in this program, you can join the developers of this program. Any contribution is appreciated!
Owner metadata
- Name:
- Login: CyanideCN
- Email:
- Kind: user
- Description: B.S. in Chemistry. Meteorology enthusiast
- Website:
- Location:
- Twitter:
- Company: University of California, Santa Barbara
- Icon url: https://avatars.githubusercontent.com/u/40656756?u=9ace2a88e102db463cdca0232eecf3f16ef51595&v=4
- Repositories: 2
- Last ynced at: 2023-04-25T16:35:40.196Z
- Profile URL: https://github.com/CyanideCN
GitHub Events
Total
- Delete event: 1
- Pull request event: 19
- Fork event: 9
- Issues event: 9
- Watch event: 42
- Issue comment event: 8
- Push event: 18
- Create event: 1
Last Year
- Pull request event: 4
- Fork event: 3
- Issues event: 2
- Watch event: 11
- Issue comment event: 3
- Push event: 7
Committers metadata
Last synced: 10 days ago
Total Commits: 478
Total Committers: 12
Avg Commits per committer: 39.833
Development Distribution Score (DDS): 0.22
Commits in past year: 9
Committers in past year: 4
Avg Commits per committer in past year: 2.25
Development Distribution Score (DDS) in past year: 0.556
| Name | Commits | |
|---|---|---|
| CyanideCN | d****7@g****m | 373 |
| CyanideCN | d****7@g****m | 74 |
| youp Li | 4****3@q****m | 19 |
| shevawen | s****n@g****m | 3 |
| ZhaJiMan | 5****n | 2 |
| zzysupernova | 4****a | 1 |
| wangliang | 1****g | 1 |
| T | A****n | 1 |
| PomGGMM | 4****M | 1 |
| Longtsing · Wang | s****s@v****m | 1 |
| Atmos.SLT | l****o@f****m | 1 |
| ww | ww@L****2 | 1 |
Committer domains:
- foxmail.com: 1
- vip.qq.com: 1
- qq.com: 1
Issue and Pull Request metadata
Last synced: 26 days ago
Total issues: 81
Total pull requests: 77
Average time to close issues: 5 months
Average time to close pull requests: 23 days
Total issue authors: 53
Total pull request authors: 14
Average comments per issue: 3.04
Average comments per pull request: 0.44
Merged pull request: 51
Bot issues: 0
Bot pull requests: 0
Past year issues: 4
Past year pull requests: 8
Past year average time to close issues: about 5 hours
Past year average time to close pull requests: 2 months
Past year issue authors: 4
Past year pull request authors: 4
Past year average comments per issue: 0.5
Past year average comments per pull request: 0.5
Past year merged pull request: 4
Past year bot issues: 0
Past year bot pull requests: 0
Top Issue Authors
- CyanideCN (16)
- liyuan3970 (4)
- hehuan710 (3)
- lovechang1986 (3)
- wangyongtao0929 (2)
- laishenggx (2)
- longtsing (2)
- ty19940610 (2)
- boyucjz (2)
- yliu-yb (2)
- lingyunfeng (1)
- Anebrithien (1)
- taort (1)
- q447552640 (1)
- wwwnnn (1)
Top Pull Request Authors
- pysoer (36)
- CyanideCN (17)
- longtsing (5)
- shevawen (4)
- ZhaJiMan (3)
- bethroughwith (3)
- sunyc1116 (2)
- PomGGMM (1)
- codacy-badger (1)
- zzysupernova (1)
- BarberQiao (1)
- bugsuse (1)
- Anebrithien (1)
- decadeneo (1)
Top Issue Labels
- component:io (16)
- component:calc (10)
- component:plot (7)
- enhancement (6)
- bug (4)
- help wanted (4)
- invalid (3)
- question (3)
- duplicate (1)
Top Pull Request Labels
- component:plot (4)
- component:io (1)
Package metadata
- Total packages: 2
- Total downloads: unknown
- Total dependent packages: 0 (may contain duplicates)
- Total dependent repositories: 0 (may contain duplicates)
- Total versions: 44
proxy.golang.org: github.com/cyanidecn/pycinrad
- Homepage:
- Documentation: https://pkg.go.dev/github.com/cyanidecn/pycinrad#section-documentation
- Licenses: gpl-3.0
- Latest release: v1.9.3 (published 7 months ago)
- Last Synced: 2026-07-20T05:14:00.079Z (3 days ago)
- Versions: 22
- Dependent Packages: 0
- Dependent Repositories: 0
-
Rankings:
- Dependent packages count: 5.401%
- Average: 5.583%
- Dependent repos count: 5.764%
proxy.golang.org: github.com/CyanideCN/PyCINRAD
- Homepage:
- Documentation: https://pkg.go.dev/github.com/CyanideCN/PyCINRAD#section-documentation
- Licenses: gpl-3.0
- Latest release: v1.9.3 (published 7 months ago)
- Last Synced: 2026-07-20T05:13:59.817Z (3 days ago)
- Versions: 22
- Dependent Packages: 0
- Dependent Repositories: 0
-
Rankings:
- Dependent packages count: 5.401%
- Average: 5.583%
- Dependent repos count: 5.764%
Dependencies
- arm_pyart
- cartopy
- cython
- matplotlib
- metpy
- numpy
- pip
- pyshp
- python 3.7.*
- setuptools
- sphinx
- sphinx_rtd_theme
- xarray
- cartopy
- cython
- matplotlib
- metpy
- numpy
- pip
- pyshp
- setuptools
- xarray
- cartopy >=0.15
- cython >0.15
- matplotlib >=2.2
- metpy >=0.8
- numpy *
- pyshp *
- cartopy >=0.15
- matplotlib >=2.2
- metpy >=0.8
- pyshp *
- vanadis *
- actions/checkout v2 composite
- actions/upload-artifact v2 composite
- conda-incubator/setup-miniconda v2 composite
Score: -Infinity