The-building-data-genome-project
A collection of non-residential buildings for performance analysis and algorithm benchmarking.
https://github.com/buds-lab/the-building-data-genome-project
Category: Consumption
Sub Category: Buildings and Heating
Keywords
commercial-building electrical-meters electricity-meter energy-efficiency feature-engineering feature-extraction jupyter-notebook open-data smart-meter temporal-data
Keywords from Contributors
ashrae building-energy kaggle kaggle-competition
Last synced: about 20 hours ago
JSON representation
Repository metadata
A collection of non-residential buildings for performance analysis and algorithm benchmarking
- Host: GitHub
- URL: https://github.com/buds-lab/the-building-data-genome-project
- Owner: buds-lab
- License: mit
- Created: 2016-05-04T04:07:20.000Z (about 10 years ago)
- Default Branch: master
- Last Pushed: 2021-03-30T12:28:32.000Z (over 5 years ago)
- Last Synced: 2026-06-12T03:04:13.258Z (about 1 month ago)
- Topics: commercial-building, electrical-meters, electricity-meter, energy-efficiency, feature-engineering, feature-extraction, jupyter-notebook, open-data, smart-meter, temporal-data
- Language: Jupyter Notebook
- Homepage: http://www.buildingdatagenome.org
- Size: 506 MB
- Stars: 196
- Watchers: 47
- Forks: 63
- Open Issues: 4
- Releases: 0
https://github.com/buds-lab/the-building-data-genome-project/blob/master/
# Check out the Building Data Genome 2 - the latest version that supercedes this one: https://github.com/buds-lab/building-data-genome-project-2

- Does your data science technique actually scale across hundreds of buildings?
- Is it actually faster or more accurate?
These are questions that researchers should ask when developing data-driven methods. Building performance prediction, classi cation, and clustering algorithms are becoming an essential part of analysis for anomaly detection, control optimization, and demand response. But how do we actually compare, each individual technique against previously created methods?
The time-series data mining community identifed this problem as early as 2003: “Much of this work has very little utility because the contribution made”...“offer an amount of improvement that would have been completely dwarfed by the variance that would have been observed by testing on many real world datasets, or the variance that would have been observed by changing minor (unstated) implementation details.” ([Keogh, E. and Kasetty, S.: On the need for time series data mining benchmarks: A survey and empirical demonstration. Data Mining and Knowledge Discovery, 7(4):349–371, Oct. 2003.](https://link.springer.com/article/10.1023/A:1024988512476))
[They created the time-series data benchmarking set](http://www.cs.ucr.edu/~eamonn/time_series_data/). This data set enables testing of new techniques on an assortment of real world data sets. For commerical buildings data, we are doing the same!
## The need for Benchmarking Data Set for Non-residential Building Data Analytics
### Most of the existing building performance data science studies rely on each individual researcher creating their own methods, finding a case study data set and determining efficacy on their own. Not surprisingly, most of those researcher find positive, yet questionably meaningful results.

### Using a large, consistent benchmark data set from hundreds (or thousands) of buildings, a researcher can determine how well their methods actually perform across a heterogeneous data set. If multiple researcher use the same data set, then there can be meaningful comparisons of accuracy, speed and ease-of-use.

## Introducing the Building Data Genome Project
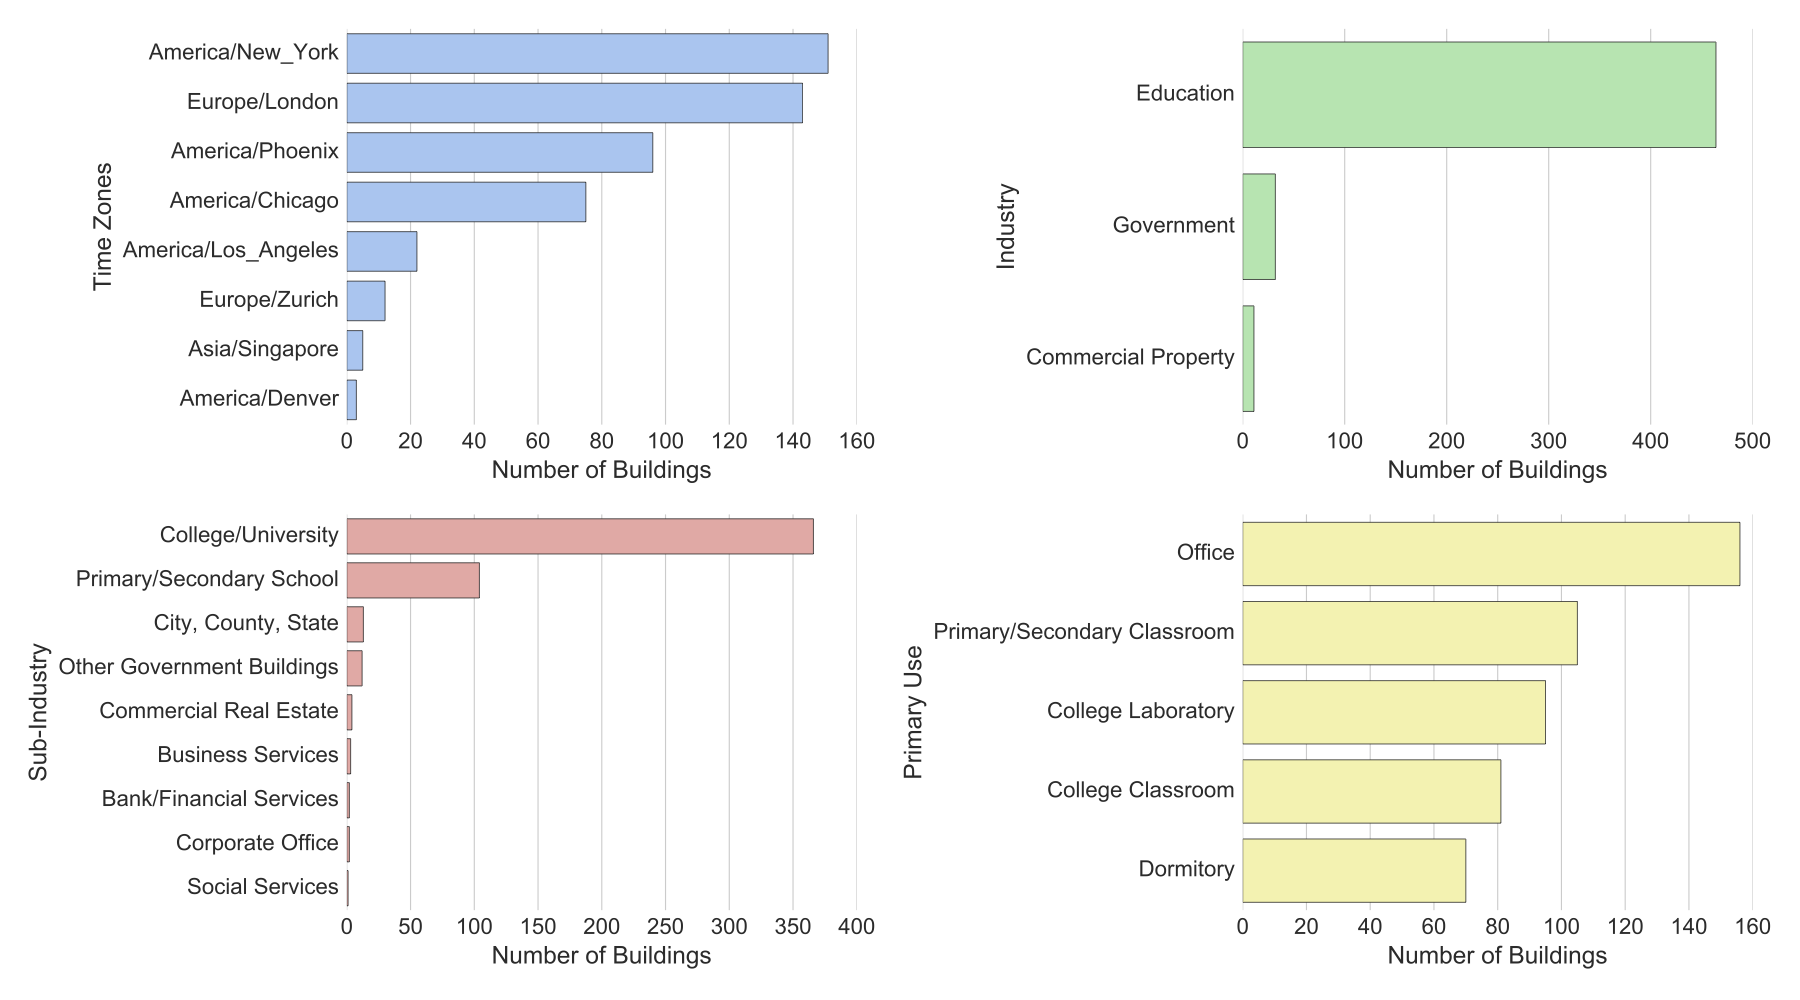
It is an open data set from 507 non-residential buildings that includes hourly whole building electrical meter data for one year. Each of the buildings has meta data such as or area, weather, and primary use type. This data set can be used to benchmark various statistical learning algorithms and other data science techniques. It can also be used simply as a teaching or learning tool to practice dealing with measured performance data from large numbers of non-residential buildings. The charts below illustrate the breakdown of the buildings according to location, building industry, sub-industry, and primary use type.
### Please contribute new data sets or provide analysis examples in Jupyter or R markdown using the data
Citation of Data-Set
------------
[Clayton Miller, Forrest Meggers, The Building Data Genome Project: An open, public data set from non-residential building electrical meters, Energy Procedia, Volume 122, September 2017, Pages 439-444, ISSN 1876-6102, https://doi.org/10.1016/j.egypro.2017.07.400.](http://www.sciencedirect.com/science/article/pii/S1876610217330047)
[ResearchGate](https://www.researchgate.net/publication/319507342_The_Building_Data_Genome_Project_An_open_public_data_set_from_non-residential_building_electrical_meters)
```
BibTex:
@article{Miller2017439,
title = "The Building Data Genome Project: An open, public data set from non-residential building electrical meters ",
journal = "Energy Procedia ",
volume = "122",
number = "",
pages = "439 - 444",
year = "2017",
note = "\{CISBAT\} 2017 International ConferenceFuture Buildings & Districts – Energy Efficiency from Nano to Urban Scale ",
issn = "1876-6102",
doi = "https://doi.org/10.1016/j.egypro.2017.07.400",
url = "http://www.sciencedirect.com/science/article/pii/S1876610217330047",
author = "Clayton Miller and Forrest Meggers",
keywords = "Open Data",
keywords = "Non-Residential Building Meter Data",
keywords = "Benchmark Data Set",
keywords = "Big Data",
keywords = "Machine Learning ",
abstract = "Abstract As of 2015, there are over 60 million smart meters installed in the United States; these meters are at the forefront of big data analytics in the building industry. However, only a few public data sources of hourly non-residential meter data exist for the purpose of testing algorithms. This paper describes the collection, cleaning, and compilation of several such data sets found publicly on-line, in addition to several collected by the authors. There are 507 whole building electrical meters in this collection, and a majority are from buildings on university campuses. This group serves as a primary repository of open, non-residential data sources that can be built upon by other researchers. An overview of the data sources, subset selection criteria, and details of access to the repository are included. Future uses include the application of new, proposed prediction and classification models to compare performance to previously generated techniques. "
}
```
Getting Started
------------
We recommend you download the [Anaconda Python Distribution](https://www.continuum.io/downloads) and use Jupyter to get an understanding of the data.
- Raw temporal and meta data are found in `/data/raw/`
Example notebooks are found in `/notebooks/` -- a few good overview examples:
- [Meta data overview](https://github.com/buds-lab/the-building-data-genome/blob/master/notebooks/00_Meta%20Data%20Exploration.ipynb)
- [Temporal data overview](https://github.com/buds-lab/the-building-data-genome/blob/master/notebooks/00_Temporal%20Data%20Exploration%20--%20Subset.ipynb)
Publications or Projects that use this data-set:
------------
Please update this list if you add notebooks or R-Markdown files to the ``notebook`` folder.
- [Miller, Clayton. “Screening Meter Data: Characterization of Temporal Energy Data from Large Groups of Non-Residential Buildings.” ETH Zürich, 2017.](https://www.research-collection.ethz.ch/handle/20.500.11850/125778) - [ResearchGate](https://www.researchgate.net/publication/313720565_Screening_Meter_Data_Characterization_of_Temporal_Energy_Data_from_Large_Groups_of_Non-Residential_Buildings)
- [Temporal Data Mining Library for Buildings](https://github.com/buds-lab/temporal-features-for-nonres-buildings-library)
# Contact -- (Add yours if you contribute to the data set)
Dr. Clayton Miller
Building and Urban Data Science (BUDS) Group
National University of Singapore
clayton@nus.edu.sg
http://budslab.org/
Dr. Forrest Meggers
Cooling and Heating for Architecturally Optimized System (CHAOS) Lab
Princeton University
fmeggers@princeton.edu
http://chaos.princeton.edu/
Anjukan Kathirgamanathan
PhD Student, Energy Institute
University College Dublin
anjukan.kathirgamanathan@ucdconnect.ie
https://energyinstitute.ucd.ie/
Project Organization
------------
├── LICENSE
├── Makefile <- Makefile with commands like `make data` or `make train`
├── README.md <- The top-level README for developers using this project.
├── data
│ ├── external <- Data from third party sources.
│ ├── interim <- Intermediate data that has been transformed.
│ ├── processed <- The final, canonical data sets for modeling.
│ └── raw <- The original, immutable data dump.
│ │ │
├── notebooks <- Jupyter notebooks. Naming convention is a number (for ordering),
│ the creator's initials, and a short `-` delimited description, e.g.
│ `1.0-jqp-initial-data-exploration`.
│
├── references <- Data dictionaries, manuals, and all other explanatory materials.
├── requirements.txt <- The requirements file for reproducing the analysis environment, e.g.
generated with `pip freeze > requirements.txt`
Project Organization
------------
The MIT License (MIT)
Copyright (c) 2016, Clayton Miller
Permission is hereby granted, free of charge, to any person obtaining a copy of this software and associated documentation files (the "Software"), to deal in the Software without restriction, including without limitation the rights to use, copy, modify, merge, publish, distribute, sublicense, and/or sell copies of the Software, and to permit persons to whom the Software is furnished to do so, subject to the following conditions:
The above copyright notice and this permission notice shall be included in all copies or substantial portions of the Software.
THE SOFTWARE IS PROVIDED "AS IS", WITHOUT WARRANTY OF ANY KIND, EXPRESS OR IMPLIED, INCLUDING BUT NOT LIMITED TO THE WARRANTIES OF MERCHANTABILITY, FITNESS FOR A PARTICULAR PURPOSE AND NONINFRINGEMENT. IN NO EVENT SHALL THE AUTHORS OR COPYRIGHT HOLDERS BE LIABLE FOR ANY CLAIM, DAMAGES OR OTHER LIABILITY, WHETHER IN AN ACTION OF CONTRACT, TORT OR OTHERWISE, ARISING FROM, OUT OF OR IN CONNECTION WITH THE SOFTWARE OR THE USE OR OTHER DEALINGS IN THE SOFTWARE.
Owner metadata
- Name: Building and Urban Data Science (BUDS) Group
- Login: buds-lab
- Email: clayton@nus.edu.sg
- Kind: organization
- Description: Building and Urban Data Science (BUDS) at the National University of Singapore
- Website: www.budslab.org
- Location: Singapore
- Twitter:
- Company:
- Icon url: https://avatars.githubusercontent.com/u/26264086?v=4
- Repositories: 66
- Last ynced at: 2024-03-26T22:05:47.632Z
- Profile URL: https://github.com/buds-lab
GitHub Events
Total
- Fork event: 2
- Watch event: 10
Last Year
- Watch event: 3
Committers metadata
Last synced: 5 days ago
Total Commits: 86
Total Committers: 4
Avg Commits per committer: 21.5
Development Distribution Score (DDS): 0.407
Commits in past year: 0
Committers in past year: 0
Avg Commits per committer in past year: 0.0
Development Distribution Score (DDS) in past year: 0.0
| Name | Commits | |
|---|---|---|
| cmiller8 | m****n@g****m | 51 |
| cmiller8 | C****n@S****l | 28 |
| Samy | p****a@i****n | 6 |
| Anjukan Kathirgamanathan | k****n@g****m | 1 |
Committer domains:
- iiitd.ac.in: 1
Issue and Pull Request metadata
Last synced: 6 months ago
Total issues: 9
Total pull requests: 0
Average time to close issues: about 1 year
Average time to close pull requests: N/A
Total issue authors: 7
Total pull request authors: 0
Average comments per issue: 0.44
Average comments per pull request: 0
Merged pull request: 0
Bot issues: 0
Bot pull requests: 0
Past year issues: 0
Past year pull requests: 0
Past year average time to close issues: N/A
Past year average time to close pull requests: N/A
Past year issue authors: 0
Past year pull request authors: 0
Past year average comments per issue: 0
Past year average comments per pull request: 0
Past year merged pull request: 0
Past year bot issues: 0
Past year bot pull requests: 0
Top Issue Authors
- cmiller8 (3)
- corymosiman12 (1)
- asdf567 (1)
- jgunstone (1)
- KGBUSH (1)
- AlejandroBaron (1)
- fmeggers (1)
Top Pull Request Authors
Top Issue Labels
Top Pull Request Labels
Score: 6.684611727667927