Global Healthy and Sustainable Cities Indicators
An open-source tool for calculating spatial indicators for healthy, sustainable cities worldwide using open or custom data.
https://github.com/global-healthy-liveable-cities/global-indicators
Category: Consumption
Sub Category: Mobility and Transportation
Keywords from Contributors
city urban city-government health public-health public-transport transportation-network urban-design urban-planning
Last synced: about 1 hour ago
JSON representation
Repository metadata
ARCHIVE COPY (see https://github.com/healthysustainablecities/global-indicators) An open-source tool for calculating spatial indicators for healthy, sustainable cities worldwide using open or custom data.
- Host: GitHub
- URL: https://github.com/global-healthy-liveable-cities/global-indicators
- Owner: global-healthy-liveable-cities
- License: mit
- Archived: true
- Fork: true (healthysustainablecities/global-indicators)
- Created: 2024-06-19T06:18:34.000Z (about 2 years ago)
- Default Branch: main
- Last Pushed: 2024-06-19T06:22:55.000Z (about 2 years ago)
- Last Synced: 2026-05-17T20:58:08.524Z (2 months ago)
- Language: Jupyter Notebook
- Homepage:
- Size: 94.1 MB
- Stars: 4
- Watchers: 0
- Forks: 2
- Open Issues: 0
- Releases: 0
https://github.com/global-healthy-liveable-cities/global-indicators/blob/main/
# Global Healthy and Sustainable Cities Indicators (global-indicators)
Please see https://github.com/healthysustainablecities/global-indicators for the current version of this software.
We have re-located the repository there under our updated organisation name, consistent with https://healthysustainablecities.org (the Global Observatory of Healthy and Sustainable Cities, which this tool has been designed to support).
An archival copy of the current repository as of 19 June 2024 has been located here, however it is recommended to use the latest software version maintained at the new repository location moving forwards.
## Summary
An open-source tool for measuring, monitoring and reporting on policy and spatial urban indicators for healthy, sustainable cities worldwide using open or custom data. Designed to support participation in the [Global Observatory of Healthy and Sustainable Cities](https://healthysustainablecities.org)' [1000 city challenge](https://www.healthysustainablecities.org/1000cities), it can be run as code or as an app in your web browser. View the full documentation of the Global Healthy and Sustainable City Indicators software at https://healthysustainablecities.github.io/software/.
This software can be configured to support comparisons within- and between-cities and across time, benchmarking, analysis and monitoring of local policies, tracking progress, and inform interventions towards achieving healthy, equitable and sustainable cities. It also support generating resources including maps, figures and reports in multiple languages, so these can be made accessible for use by local communities and stakeholders as a source of evidence to advocate for change.
## What exactly does this do?
As a result of running the process, a core set of spatial indicators for healthy and sustainable cities are calculated for point locations, a small area grid (e.g. 100m), and overall city estimates. Optionally, indicators can also be calculated for custom areas, like administrative boundaries or specific neighbourhoods of interest. In addition CSV files containing indicators for area summaries and the overall city are also generated, omitting geometry.
The default core set of spatial urban indicators calculated includes:
- Urban area in square kilometers
- Population density (persons per square kilometre)
- Street connectivity (intersections per square kilometer)
- Access to destinations within 500 meters:
- a supermarket
- a convenience store
- a public transport stop (any; or optionally, regularly serviced)
- a public open space (e.g. park or square; any, or larger than 1.5 hectares)
- A score for access to a range of daily living amenities
- A walkability index
The tool can also be used to summarise and visualise a policy audit conducted using the 1000 Cities challenge tool.
Generated outputs include:
- Summary of configuration parameters used for analysis (.yml file)
- Processing log detailing the analyses undertaken (.txt file)
- Geopackage of indicator results and spatial features including points and areas of interest and pedestrian network (.gpkg)
- CSV files for indicator results (.csv)
- Data dictionaries (.csv and .xlsx files)
- ISO19115 metadata (.xml and .yml files)
- Analysis report (pdf)
- Policy and spatial indicator report, optionally in multiple languages (.pdf)
- Figures and maps, optionally in multiple languages (.jpg)
The resulting city-specific resources can be used to provide evidence to support policy makers and planners to target interventions within cities, compare performance across cities, and when measured across time can be used to monitor progress for achieving urban design goals for reducing inequities. Moreover, they provide a rich source of data for those advocating for disadvantaged and vulnerable community populations, to provide evidence for whether urban policies for where they live are serving their needs.
## How to set up and get started?
### Software installation and set up
1. Download and unzip the [latest GHSCI software release](https://github.com/global-healthy-liveable-cities/global-indicators/releases) to a desired project directory on your computer
2. Install and run [Docker Desktop](hhttps://docs.docker.com/desktop/) according to the guidelines for your operating system of choice
3. Run the GHSCI software by opening the project directory where you extracted the software using a command line interface (e.g. [Terminal](https://aka.ms/terminal) on Windows, [Terminal](https://support.apple.com/en-au/guide/terminal/apd5265185d-f365-44cb-8b09-71a064a42125/mac) on MacOS, or [Bash](https://www.gnu.org/software/bash/) on Linux):
- on Windows open the folder in Terminal or cmd.exe and enter `.\global-indicators.bat`
- on MacOS/Linux in bash, enter `bash ./global-indicators.sh`
- Linux users may need to prefix this with 'sudo' for elevated permissions when launching Docker containers (read more [here](https://docs.docker.com/engine/install/linux-postinstall))
This will retrieve the computational environment and launch the Global Healthy and Sustainable City Indicators (GHSCI) software, along with a PostGIS spatial database that is used for processing and data management. Once launched, instructions will be displayed.
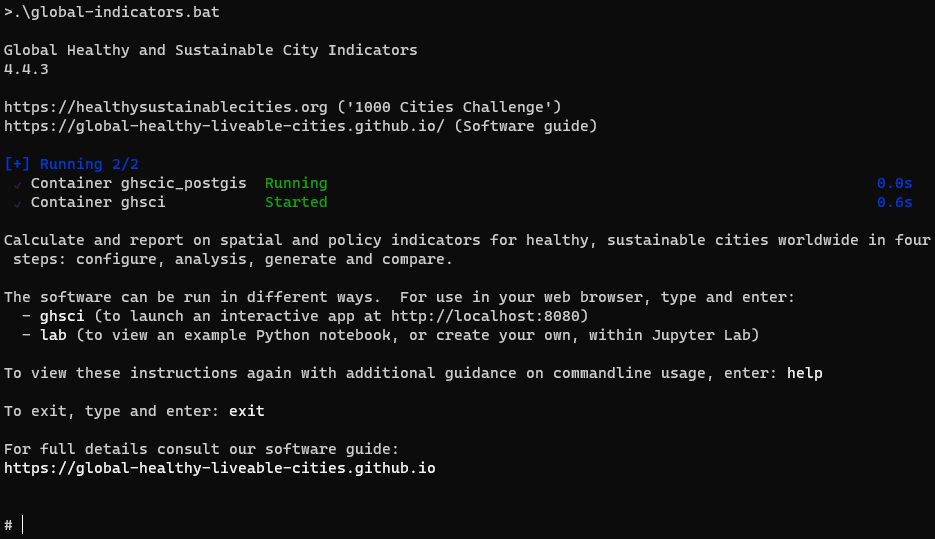
The software can be used to configure study regions, conduct analysis and generate resources in four ways, depending on preference:
- To launch the app in your web browser, type `ghsci` and open the displayed URL in your web browser
- To use a Jupyter Notebook, type `lab`, open the displayed URL in your web browser and double click to select the example notebook `example.ipynb` from the left-hand side browser pane
- The basic shortcut commands `configure`, `analysis`, `generate` and `compare` can be run at the commandline in conjunction with a codename referring to your study region
- Optionally, the process can be run in Python, for example:
```
# load the GHSCI software library
import ghsci
# load the example configured region
r = ghsci.example()
# or set a codename for your city, and use it to initialise or load a new region.
# The ghsci.example() is a shortcut for the following, that you could use for your own new study region.
codename = 'example_ES_Las_Palmas_2023'
r = ghsci.Region(codename)
# Once that is completed, you can proceed with analysis
r.analysis()
# and generating resources
r.generate()
# if you've analysed and generated results for other study regions, you can summarise the overall differences
r.compare('another_previously_processed_codename')
# if for some reason you want to drop the database for your study region to start again:
r.drop()
# You will be asked if you really want to do this! It requires entering "ghscic" to confirm
# This doesn't remove any generated files or folders - you'll have to remove those yourself, if you want to
```
## Overview
The Global Healthy and Sustainable Cities Indicators (GHSCI) tool can be run in a web browser or as Python code (e.g. in Jupyter Lab). Once the software environment has been retrieved and running, analysis for a particular city proceeds in four steps:
1. Configure study regions
2. Perform region analysis
3. Generate resources
4. Compare results (e.g. impact of hypothetical scenarios and sensitivity analyses, benchmarking between cities or regions of interest, monitoring change across time)
A fully configured example study region is provided along with data for users to familiarise themselves with the workflow and the possibilities of the generated resources. Our [website](https://global-healthy-liveable-cities.github.io) provides detailed directions on how to perform the four-step process, and how to access, run and modify the provided example Jupyter notebook to perform analyses for your own study regions.
### Running the provided example
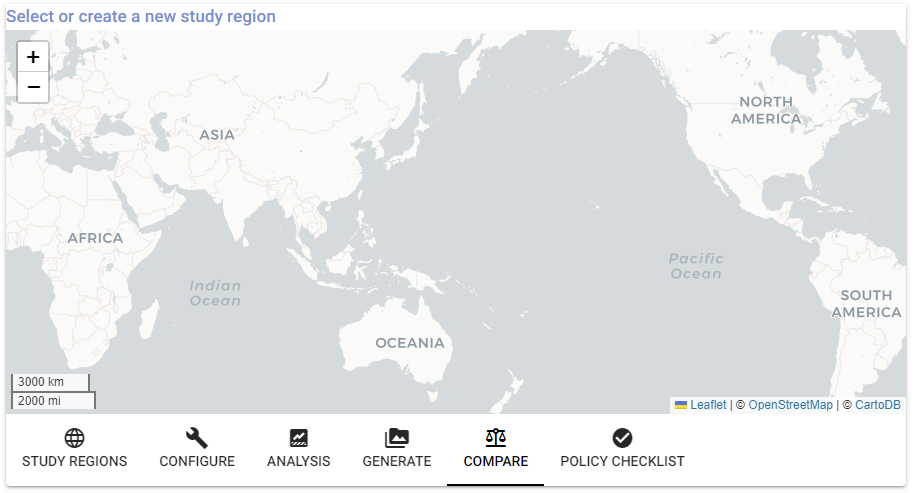
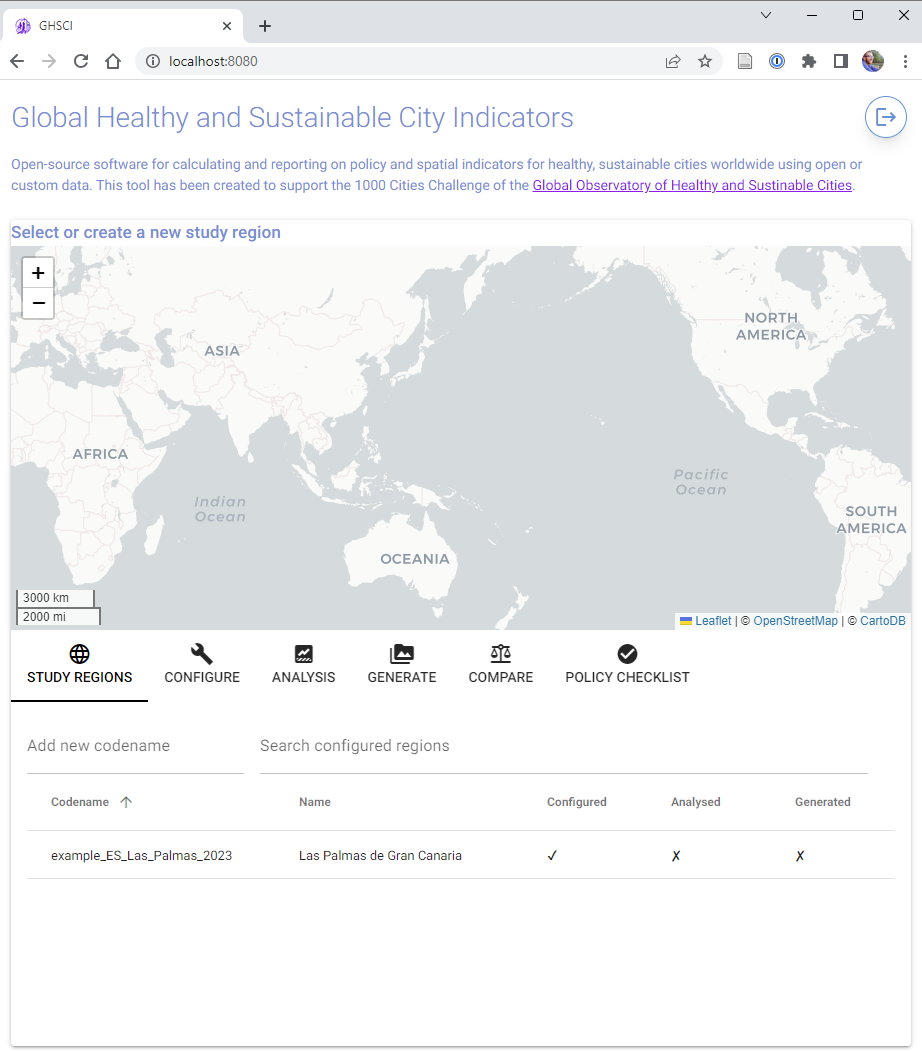
From the launched software prompt, type `ghsci` to start the web app and click the displayed link to open a web browser at http://localhost:8080
The Global Healthy and Sustainable City Indicators app opens to a tab for selecting or creating a new study region. The software comes with an example configuration for the city of Las Palmas de Gran Canaria, Spain, that we can see has been `Configured` but hasn't yet had `Analysis` perormed or resources `Generated`. Once two configured regions have had their resources generated, they can be compared. Additionally, the results of a completed [policy checklist](https://global-healthy-liveable-cities.github.io/indicators/#Policy-indicator-analysis) can be summarised and queried.
To run the example, click to select 'example_ES_Las_Palmas_2023' in the table, head to the `Analysis` tab and click the button. While analysis is being conducted, progress will be summarised in the terminal. This may take a few minutes to complete:
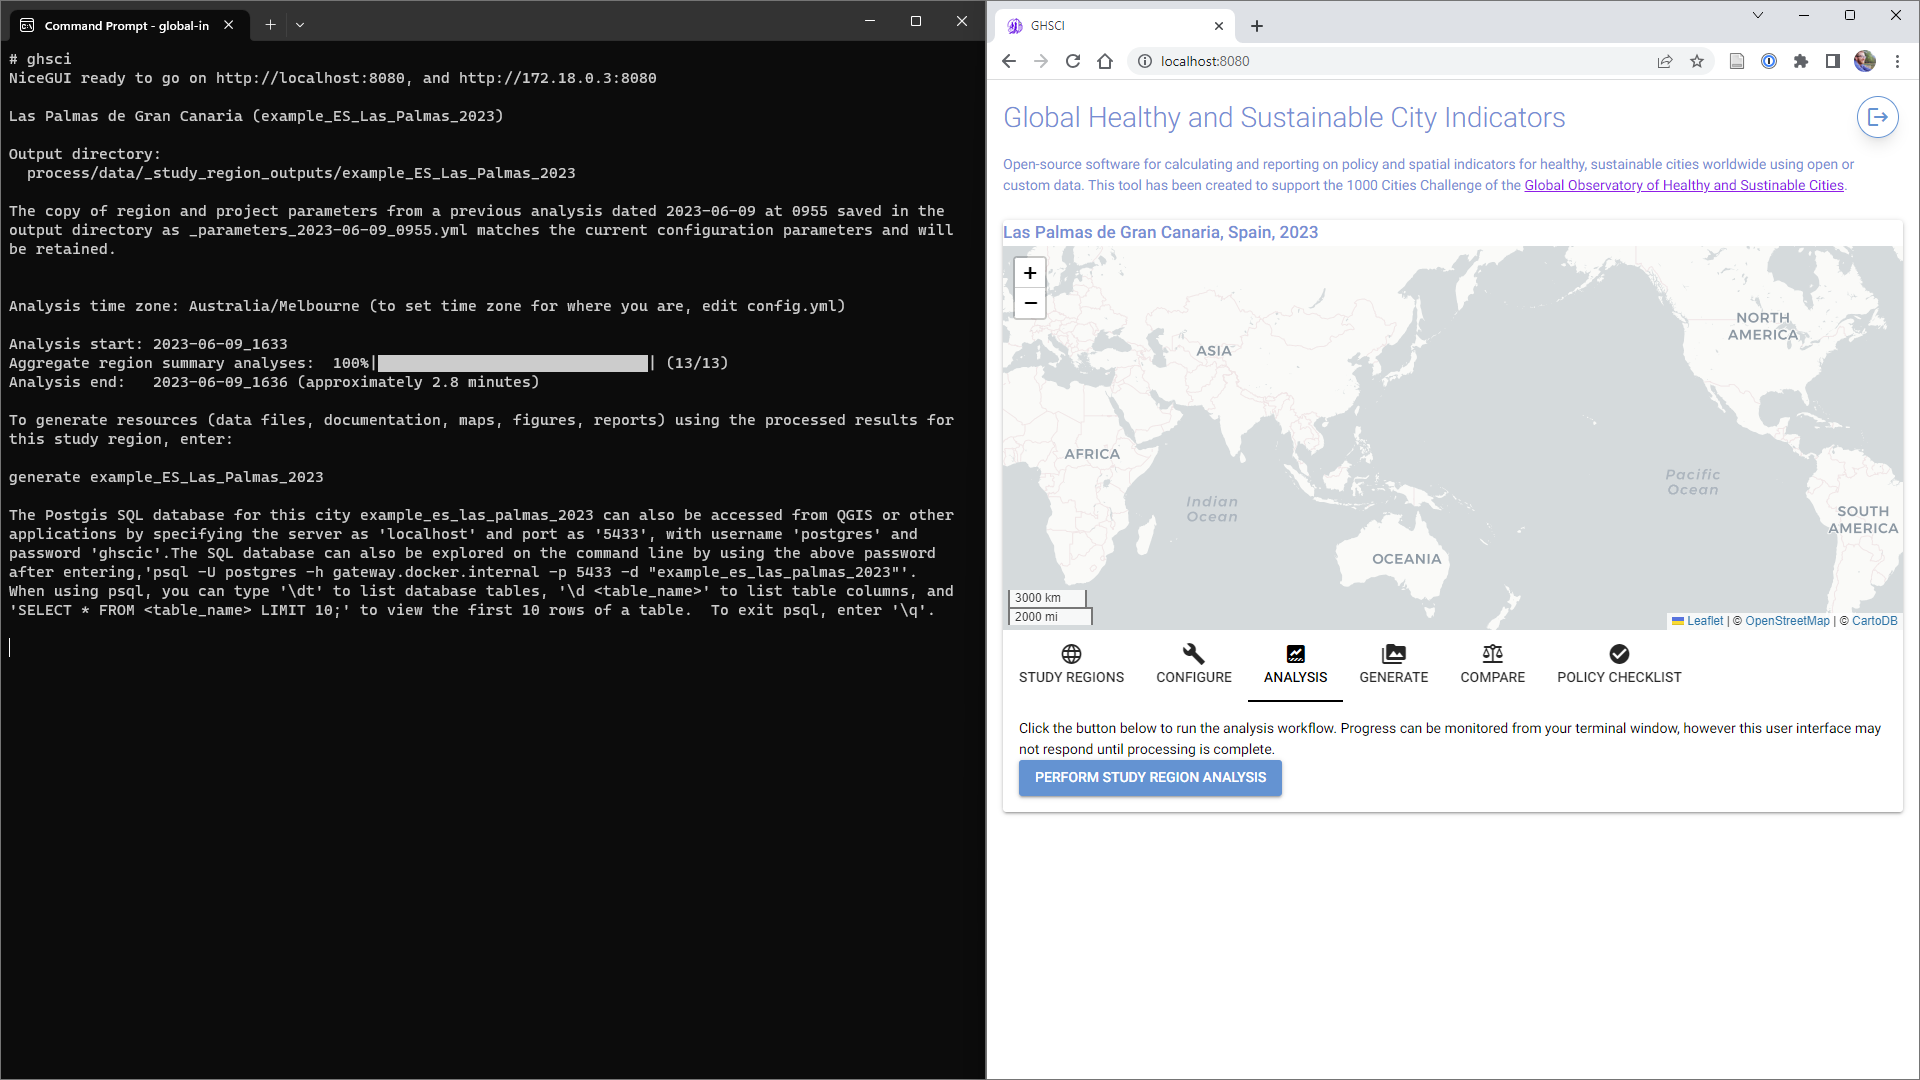
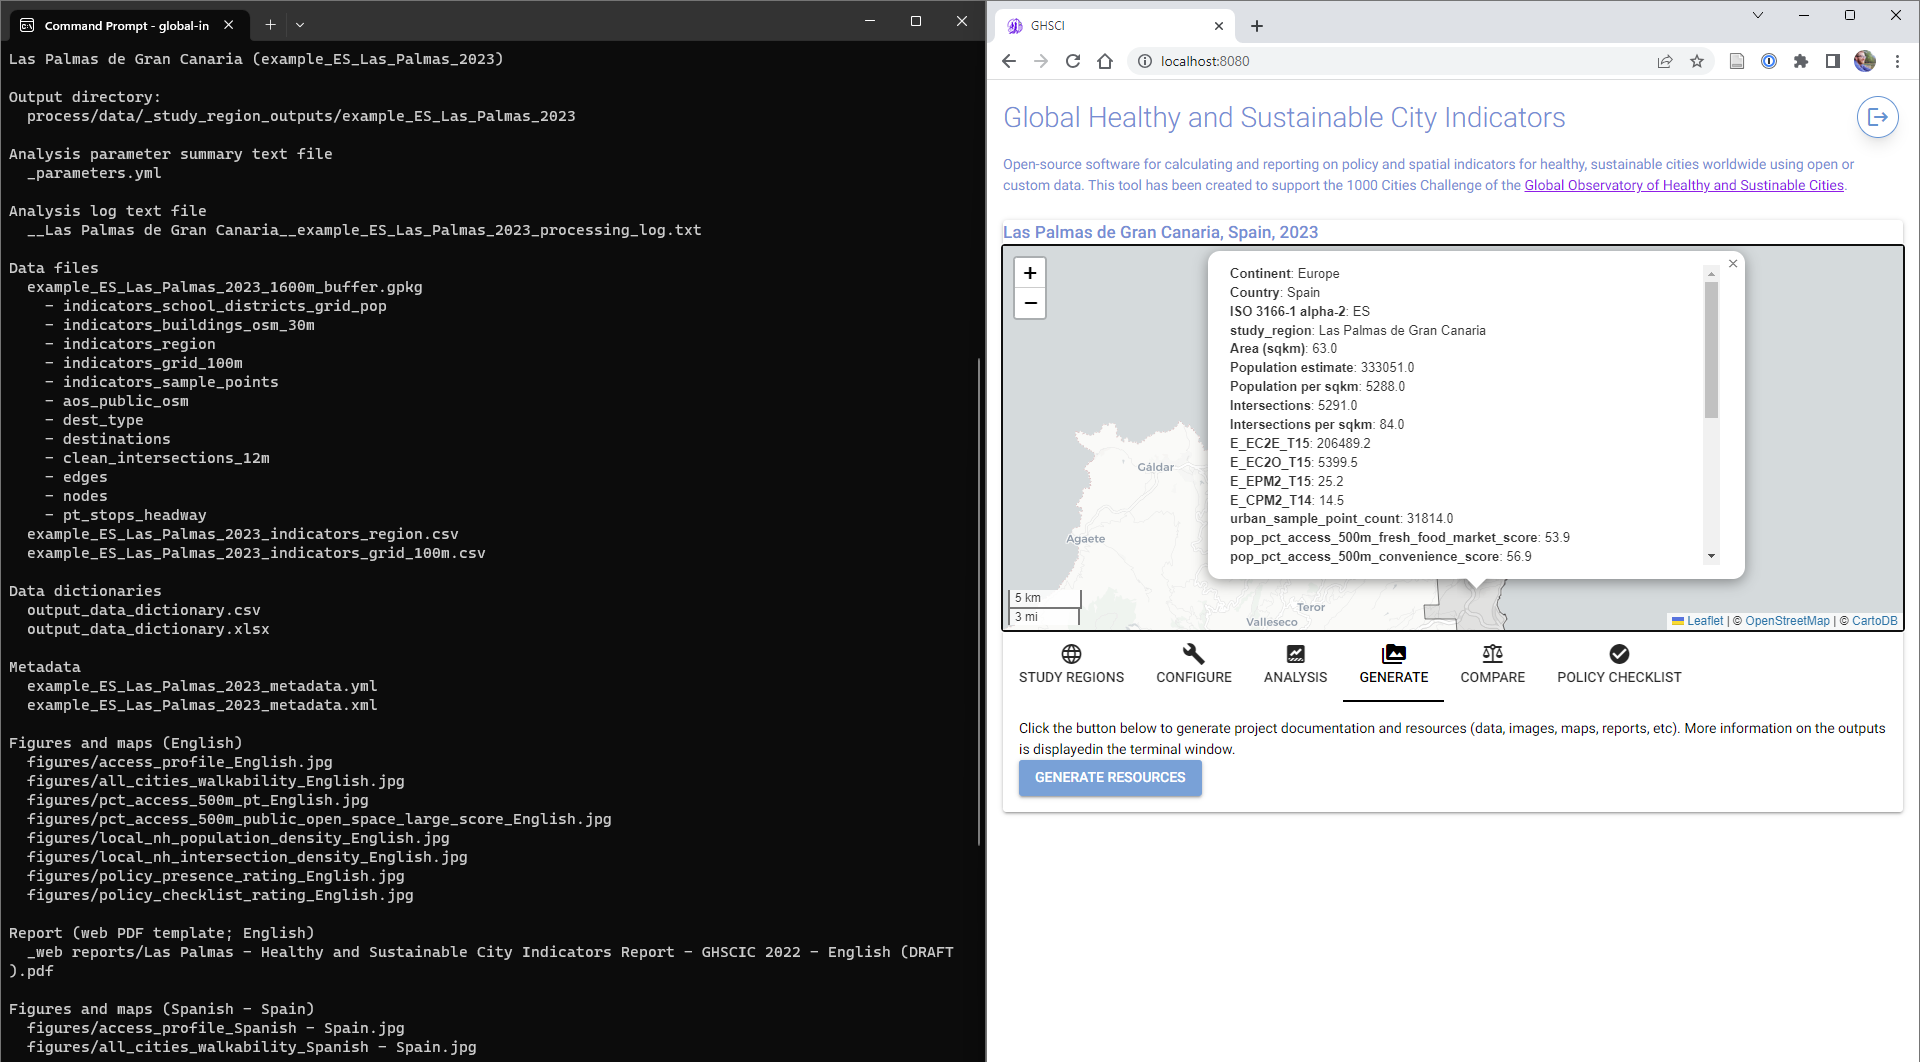
Once completed, the study region summary will have the `Analysed` check box ticked and if you click to select the example in the table it will display the configured study region boundary on the map:

Click the study region to view a popup summary of the core set of indicators calculated (spatial distribution data will be generated shortly, and directions for producing an interactive map are provided in the example Jupyter notebook).
To generate the range of resources listed above, with the example city selected navigate to the `Generate` tab and click the `Generate resources` button. A series of outputs generated will be reported in the terminal window:
You can use the `Compare` function to
- evaluating the overall impact of parameters and data used (sensitivity analyses)
- compare results of different cities (benchmarking)
- compare results for the same study region across time (monitoring)
- evaluate the impact of hypothetical scenarios or interventions through analysis of modified data to represent these
As an example of a sensitivity analysis of the urban boundary used for analysis:
- take a copy of the 'example_ES_Las_Palmas_2023.yml' file and save it as `ES_Las_Palmas_2023_test_not_urbanx`.
- Open this file in a text editor and
- modify the entry under study_region_boundary reading `ghsl_urban_intersection: true` to `ghsl_urban_intersection: false`
- modify the value of the parameter entry for 'notes' (line 57) to read "This supplementary configuration file for the broader administrative boundary region of Las Palma allows the impact of restricting analysis to the urban region (as per the main example) to be evaluated."
- now, exit the application (click the button in the top right hand corner) and restart the application
- select the new region and perform the analysis and generate resources steps
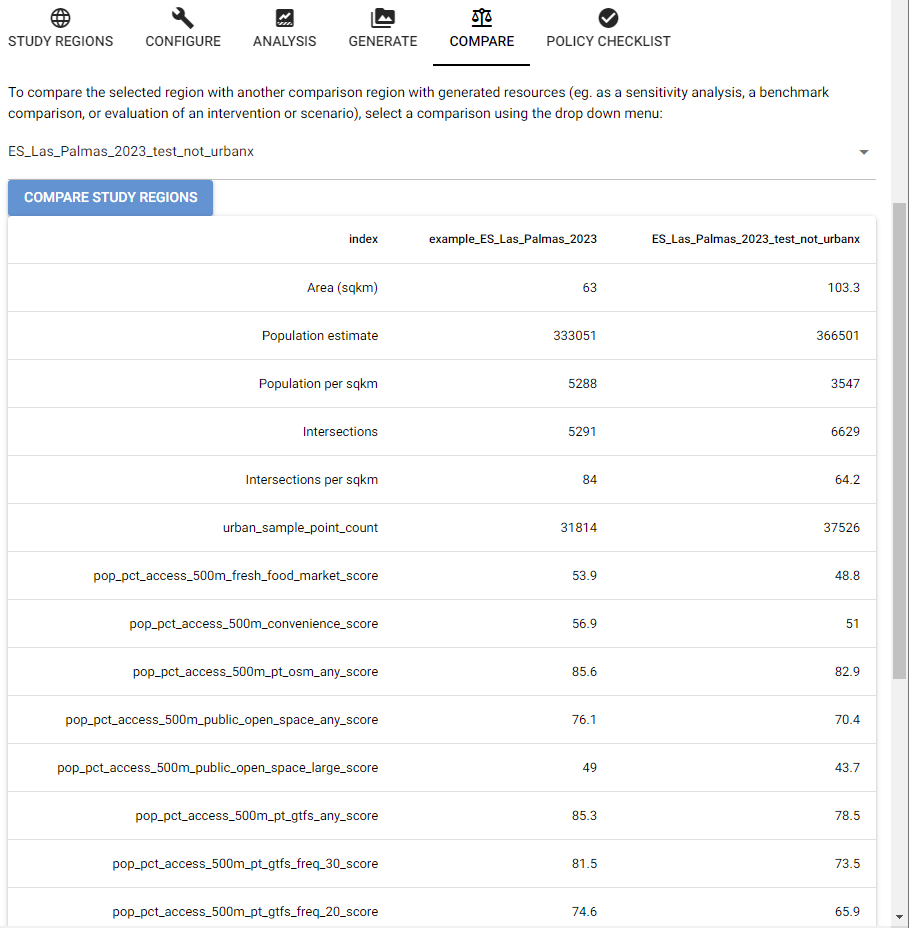
- select the `example_ES_Las_Palmas_2023` study region and navigate to the `Compare` tab
- select the `ES_Las_Palmas_2023_test_not_urbanx` region from the comparison drop down menu and click `Compare study regions` to generate a comparison CSV in the example study region's output folder (`process\data\_study_region_outputs\example_ES_Las_Palmas_2023`) and display a table with sideby side comparison of the overall region statistics and indicator estimates in the app window:
### Exit the software
To exit the web application click the **exit** button in the top right-hand corner. At the end of a Jupyter session, in the menu click _File > Shut Down_. If you close a browser window with the Jupyter Lab or GHSCI app still running, the underlying server process running these may be interrupted by pressing `Control+C` at the command prompt.
To run the analysis for your study region visit our website for detailed instructions on how to configure [a new study region](https://global-healthy-liveable-cities.github.io/software/#Details) and what [input data is required](https://global-healthy-liveable-cities.github.io/software/#Data).
## Citations
The software was developed by the [Global Healthy and Sustainable City Indicators Collaboration](https://www.healthysustainablecities.org/about#team) team, an international partnership of researchers and practitioners, extending methods developed by the [Healthy Liveable Cities Lab](https://cur.org.au/research-programs/healthy-liveable-cities-group/) at RMIT University and incorporating functionality from the [OSMnx](https://github.com/gboeing/osmnx) tool developed by Geoff Boeing.
The concept underlying the framework is described in:
Liu S, Higgs C, Arundel J, Boeing G, Cerdera N, Moctezuma D, Cerin E, Adlakha D, Lowe M, Giles-Corti B (2022) A Generalized Framework for Measuring Pedestrian Accessibility around the World Using Open Data. Geographical Analysis. 54(3):559-582. https://doi.org/10.1111/gean.12290
The tool was designed to be used for a 25-city comparative analysis, published as:
Boeing G, Higgs C, Liu S, Giles-Corti B, Sallis JF, Cerin E, et al. (2022) Using open data and open-source software to develop spatial indicators of urban design and transport features for achieving healthy and sustainable cities. The Lancet Global Health. 10(6):e907–18. https://doi.org/10.1016/S2214-109X(22)00072-9
The process of scaling up residential analysis of liveability and sustainability indicators for diverse urban contexts is the topic of Carl Higgs' PhD research and is described in:
Higgs, C. et al. (2022) ‘Policy-Relevant Spatial Indicators of Urban Liveability And Sustainability: Scaling From Local to Global’, Urban Policy and Research, 40(4). Available at: https://doi.org/10.1080/08111146.2022.2076215.
## Acknowledgements
This software is an officially sponsored Docker Open Source Software Project (https://hub.docker.com/u/globalhealthyliveablecities). The [broader programme of work this software supports](https://www.healthysustainablecities.org/about) received the Planning Institute of Australia's 2023 national award for Excellence in Planning Research.
Our approach, while supporting the optional use of custom data, was founded with an [open science ethos](https://www.unesco.org/en/open-science) and promotes the usage of global open data produced by individuals, organisations and governments including OpenStreetMap Contributors ([OpenStreetMap](https://wiki.openstreetmap.org/)), the European Commission Joint Research Centre ([Global Human Settlements Layer](https://ghsl.jrc.ec.europa.eu/)), and open data portals in general. We gratefully acknowledge the valuable contributions to transparency, equity and science open data initiatives such as these and the producers of open source software underlying our work bring to the world.
Open source software we have used and which is included in our software environment includes [Python](https://www.python.org/) (programming language), [Docker](https://www.docker.com/) (software containerisation), [Conda](https://anaconda.org/) (package management), [PostgreSQL](https://www.postgresql.org/) (database), [PostGIS](http://postgis.net/) (spatial database), [pgRouting](https://pgrouting.org/) (routing analysis), [GDAL/OGR](https://doi.org/10.5281/zenodo.5884351) (Geospatial Data Abstraction software Library), [OSMnx](https://doi.org/10.1016/j.compenvurbsys.2017.05.004) (OpenStreetMap retrieval and network analysis), [NetworkX](https://networkx.org/) (network analysis), [NiceGUI](https://doi.org/10.5281/zenodo.8083457) (graphical user interface), [Jupyter Lab](https://jupyter.org/) (scientific code notebooks), [Pandas](https://pandas.pydata.org/) (dataframes), [GeoPandas](https://geopandas.org/en/stable/) (spatial dataframes), [GeoAlchemy](https://github.com/geoalchemy/geoalchemy2) (spatial SQL management), [SQLAlchemy](https://www.sqlalchemy.org/) (SQL management), [Pandana](https://github.com/UDST/pandana) (network analysis using pandas), [Rasterio](https://rasterio.readthedocs.io/en/stable/) (raster analysis), [GTFS-Lite](https://github.com/wklumpen/gtfs-lite/tree/master) (GTFS parsing), [Git](https://git-scm.com/) (source code management), [GitHub](https://github.com/about) (development platform), [Leaflet](https://leafletjs.com/) and Fabio Crameri's [Scientific colour maps](https://doi.org/10.5281/zenodo.1243862).
## How to contribute
### If you've found an issue or want to request a new feature:
- check the [issues](https://github.com/global-healthy-liveable-cities/global-indicators/issues) first
- open an new issue in the [issue tracker](https://github.com/global-healthy-liveable-cities/global-indicators/issues) filling out all sections of the template, including a minimal working example or screenshots so others can independently and completely reproduce the problem
### If you want to contribute to a feature:
- post your proposal on the [issue tracker](https://github.com/global-healthy-liveable-cities/global-indicators/issues)
- fork the repo, make your change (adhering to existing coding, commenting, and docstring styles)
- Create your feature branch: `git checkout -b my-new-feature`
- Commit your changes: `git commit -am 'Add some feature'`
- Push to the branch: `git push origin my-new-feature`
- Submit a pull request.
Citation (https://github.com/global-healthy-liveable-cities/global-indicators/blob/main/)
cff-version: 1.2.0
message: If you use this software, please cite it as below.
authors:
    - family-names: Higgs
      given-names: Carl
    - family-names: Liu
      given-names: Shiqin
    - family-names: Boeing
      given-names: Geoff
    - family-names: Arundel
      given-names: Jonathan
    - family-names: Lowe
      given-names: Melanie
    - family-names: Adlakha
      given-names: Deepti
    - family-names: Resendiz
      given-names: Eugen
    - family-names: Heikinheimo
      given-names: Vuokko
    - family-names: Giles-Corti
      given-names: Billie
    - family-names: Delclòs-Alió
      given-names: Xavier
    - family-names: Puig-Ribera
      given-names: Anna
    - family-names: Vargas
      given-names: Julio Celso Borello
    - family-names: Castillo-Riquelme
      given-names: Marianela
    - family-names: Jafari
      given-names: Afshin
    - family-names: Molina-García
      given-names: Javier
    - family-names: Queralt
      given-names: Ana
    - family-names: Cerin
      given-names: Ester
    - family-names: Suel
      given-names: Esra
    - family-names: Domínguez-Mallafré
      given-names: Marc
    - family-names: Ye
      given-names: Yang
    - family-names: Moudon
      given-names: Anne Vernez
    - family-names: Hinckson
      given-names: Erica
    - family-names: Salvo
      given-names: Deborah
    - family-names: Sallis
      given-names: James F.
    - family-names: Leão
      given-names: Ana Luiza Favarão
    - family-names: Hernandez-Alcaraz
      given-names: Cesar
title: Global Healthy and Sustainable City Indicators software
version: 4.5.1
date-released: 2024-05-16
url: https://healthysustainablecities.github.io/
doi: 10.25439/rmt.24760260.v1
Owner metadata
- Name: Global Healthy and Sustainable City-Indicators Collaboration
- Login: global-healthy-liveable-cities
- Email:
- Kind: organization
- Description: Global Healthy and Sustainable City-Indicators Collaboration
- Website:
- Location: Melbourne, Australia
- Twitter:
- Company:
- Icon url: https://avatars.githubusercontent.com/u/79161640?v=4
- Repositories: 2
- Last ynced at: 2023-03-08T12:10:22.067Z
- Profile URL: https://github.com/global-healthy-liveable-cities
GitHub Events
Total
- Fork event: 1
- Watch event: 3
Last Year
- Watch event: 1
Committers metadata
Last synced: 13 days ago
Total Commits: 1,325
Total Committers: 16
Avg Commits per committer: 82.813
Development Distribution Score (DDS): 0.41
Commits in past year: 0
Committers in past year: 0
Avg Commits per committer in past year: 0.0
Development Distribution Score (DDS) in past year: 0.0
| Name | Commits | |
|---|---|---|
| Carl Higgs | c****s@g****m | 782 |
| nicholas-david | 6****d | 142 |
| Shirley Liu | 4****u | 132 |
| Geoff Boeing | b****g@u****u | 109 |
| thuanguy | 5****y | 63 |
| Zac Wang | z****g@s****u | 18 |
| ShirleyLiu | S****u@e****m | 16 |
| zacwang | k****9@g****m | 14 |
| Daria Pugacheva | 1****a | 14 |
| Jonathan | j****l@r****u | 10 |
| Zac Wang | 5****9 | 9 |
| DRosasMoctezuma | r****o@u****u | 6 |
| rychennn | r****n@g****m | 6 |
| root | r****t@l****t | 2 |
| gkieszkowski | g****i@g****m | 1 |
| root | r****t@f****f | 1 |
Committer domains:
- usc.edu: 2
- rmit.edu.au: 1
- spatialvision.com.au: 1
Issue and Pull Request metadata
Last synced: 11 months ago
Total issues: 107
Total pull requests: 68
Average time to close issues: about 1 month
Average time to close pull requests: 23 days
Total issue authors: 9
Total pull request authors: 4
Average comments per issue: 1.15
Average comments per pull request: 0.5
Merged pull request: 41
Bot issues: 0
Bot pull requests: 25
Past year issues: 0
Past year pull requests: 0
Past year average time to close issues: N/A
Past year average time to close pull requests: N/A
Past year issue authors: 0
Past year pull request authors: 0
Past year average comments per issue: 0
Past year average comments per pull request: 0
Past year merged pull request: 0
Past year bot issues: 0
Past year bot pull requests: 0
Top Issue Authors
- carlhiggs (94)
- dapugacheva (2)
- ryn-trnr (1)
- tiernanmartin (1)
- eugenrb (1)
- ruoyuch (1)
- dependabot[bot] (1)
- gigioLR (1)
- gboeing (1)
Top Pull Request Authors
- carlhiggs (55)
- dependabot[bot] (41)
- dapugacheva (4)
- rychennn (4)
Top Issue Labels
- enhancement (26)
- bug (8)
- user process to document (5)
- dependencies (1)
Top Pull Request Labels
- dependencies (43)
- enhancement (2)
Score: 4.1588830833596715